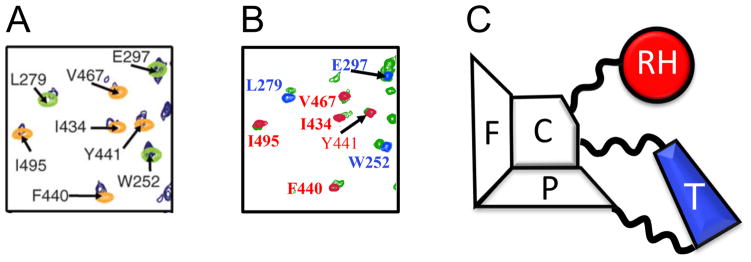
Figure 7. Comparison of an expanded spectral region of the p66/p66 dimer and the p66ΔPL monomer.
A) region of the 1H-15N spectrum presented by [20]: (Δ1H,Δ15N) ~ (9.1–9.8 ppm, 122–128 ppm). Color coding is: p66, dark blue; thumb, green; RH, yellow. B) Corresponding region of the 1H-15N spectrum of U-[2H,15N]p66ΔPL (green) overlaid with spectra for the RH (red) and thumb (blue) domains. C) Schematic illustration of the p66 monomer structure based on Figure 1, color coded to illustrate the domain origin of the corresponding resonances.

