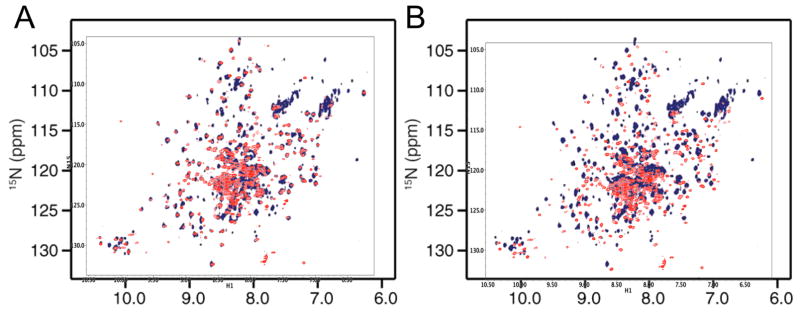
Figure 8. Comparison of monomer and dimer spectra.
A) Overlaid NMR spectrum attributed to the p66/p66 homodimer (dark blue, [20]), with the 1H-15N TROSY spectrum obtained for U-[2H,15N]p66ΔPL (red). The offsets were selected to optimize resonance consistency. B) Overlaid spectra as in A using the reported referencing.

