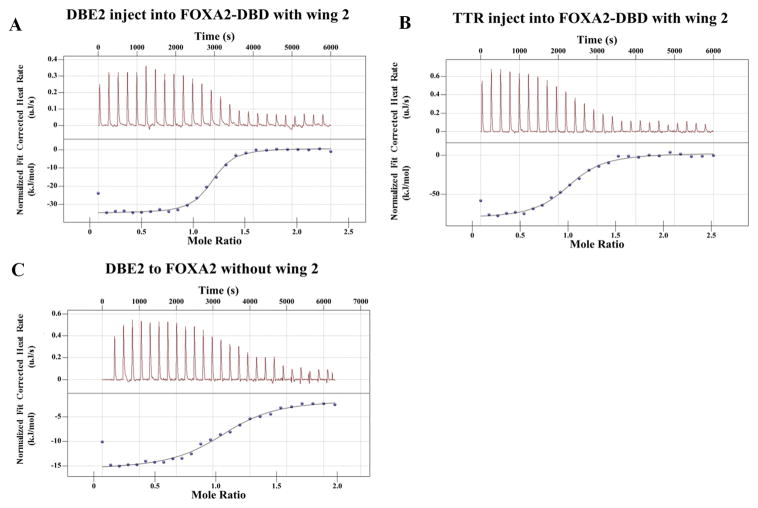
Figure 3.
Binding affinity measurement of protein-DNA interactions by quantitative ITC. (A–C) Quantification of the interaction between FOXA2 DBD and DNA derived from different DNA by ITC. Representative power-response curves (top) and heats of reaction normalized to the moles of protein injected (bottom).

