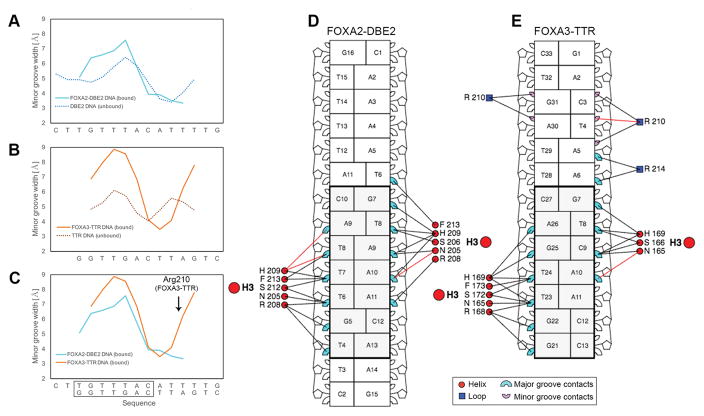
Figure 5.
Structural analysis of FOXA2 and FOXA3 DNA binding sites. (A–C) Minor groove width of FOXA-bound and unbound DNAs, showing comparisons between (A) FOXA2 bound DBE site vs. unbound DBE2 site, (B) FOXA3 bound TTR site vs. unbound TTR site, and (C) FOXA2 bound DBE2 vs. FOXA3 bound TTR. (D–E) Schematic diagrams show interactions between the forkhead domain and the DNA major and minor groove in a nucleotide-residue interaction map for (D) FOXA2-DBD/DBE2 and (E) FOXA3-DBD/TTR. Nucleotide-residue red and black lines represent interactions which involve hydrogen bonds or other contacts, respectively. Images were generated with DNAproDB 31. Black rectangles (panels C, D and E) highlight the core binding element recognized by these FOXA proteins.

