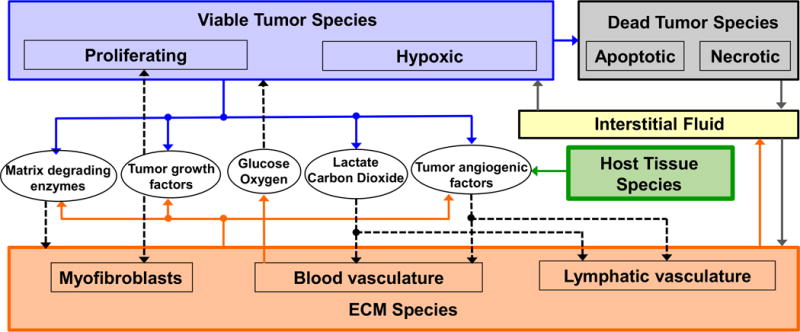
Figure 1.

Graphical overview of the main model components and their interactions. Solid arrows indicate outputs from a component, while dashed arrows indicate particular inputs. Arrows penetrating into the boxes highlight specific recipients associated with particular input. For example, tumor growth factors are output by the viable tumor species and the stromal elements, and the growth factors in turn influence the behavior of proliferating tumor cells and myofibroblasts.
