Figure 10.

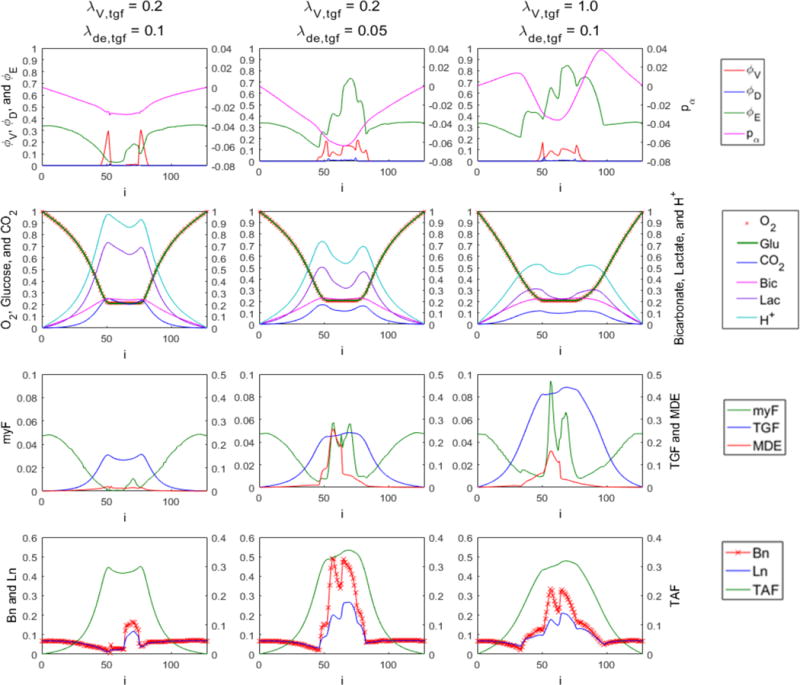
Desmoplastic tumor simulations at t = 20 for a decreased-TGF case ( and ), the base case shown in Figure 1 ( and ), and an increased-TGF case ( and ).

Desmoplastic tumor simulations at t = 20 for a decreased-TGF case ( and ), the base case shown in Figure 1 ( and ), and an increased-TGF case ( and ).