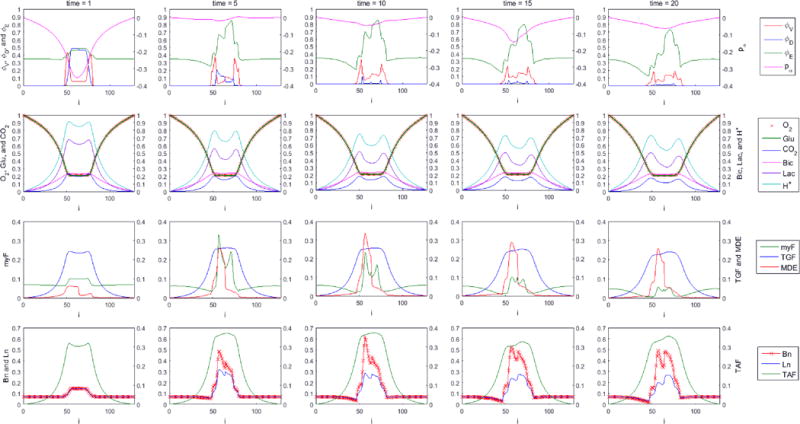
Figure 2.

Desmoplastic tumor evolution with regionally varied . Time progression from left to right for t = 1, 5, 10, 15, and 20, and plots are made for a cross section of the index plane j = k = 58. First row: tumor viable species , dead species , and ECM species . The overall tumor pressure is labeled by pα. Second row: diffusible substances driving the tumor evolution, including oxygen (O2), glucose (Glu), carbon dioxide (CO2), bicarbonate (Bic), lactate (Lac), and hydrogen ions (H+). Third row: Concentration of myfibroblasts (myF), tumor growth factors (TGF), and matrix degrading enzymes (MDE). Fourth row: corresponding density of blood vasculature (Bn), lymphatic vasculature (Ln), and tumor angiogenic factors (TAF).
