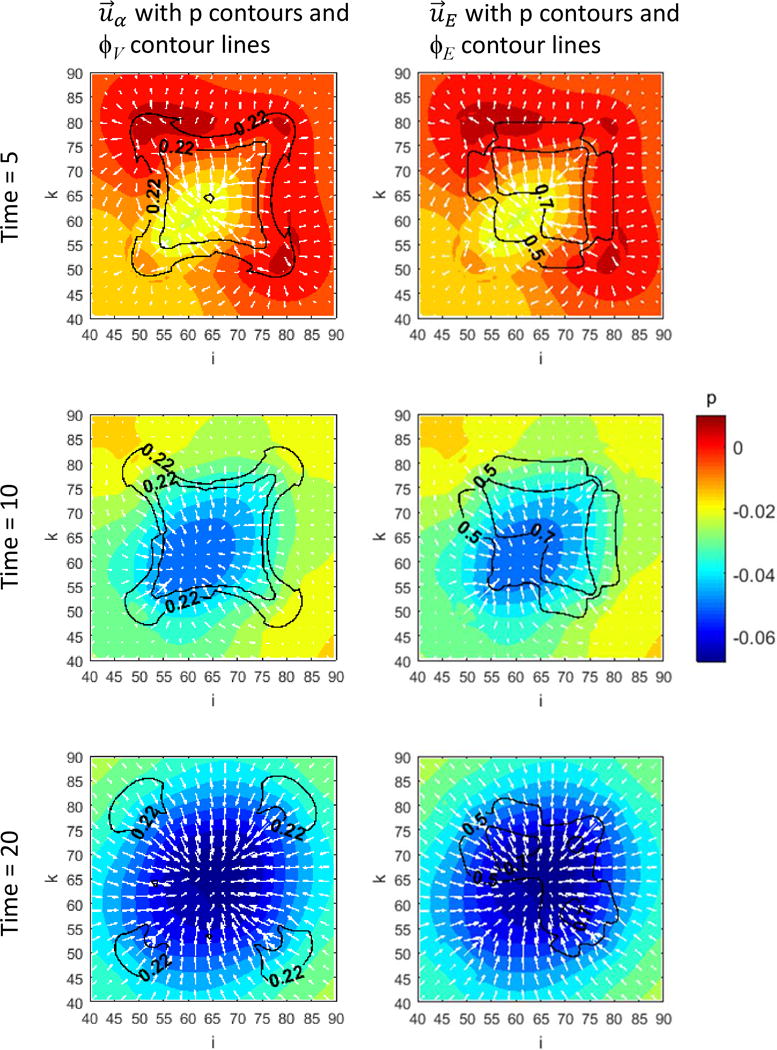
Figure 5.

Evolution of viable tissue and ECM species (2D plot) with their corresponding velocity fields and pressure gradients. Plotted for t = 5, 10, and 20, in a sub-section of the x – z plane (at index j = 58). The arrows denote the velocity vectors, with longer arrows indicating a higher magnitude.
