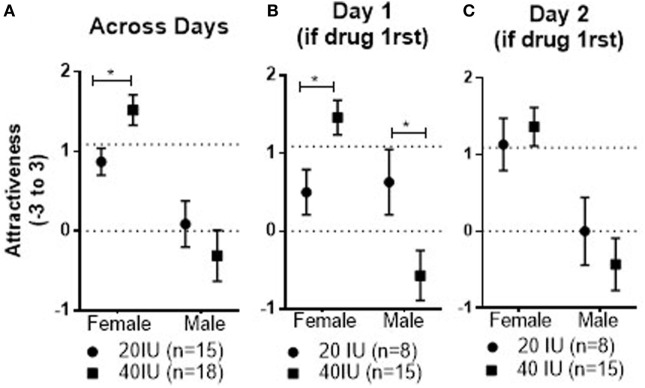
Figure 4.
Mean ± SEM of Attractiveness ratings of male and female faces across days in coupled men who received 20 or 40 IU on either day (A), as well as responses on day 1 (B) and day 2 (C) in coupled men who received 20 or 40 IU on day 1. The top dotted line shows the mean response to female faces on day 1 in coupled men who received placebo on that day, the bottom dotted line the mean response to male faces in men who received placebo on day 1.

