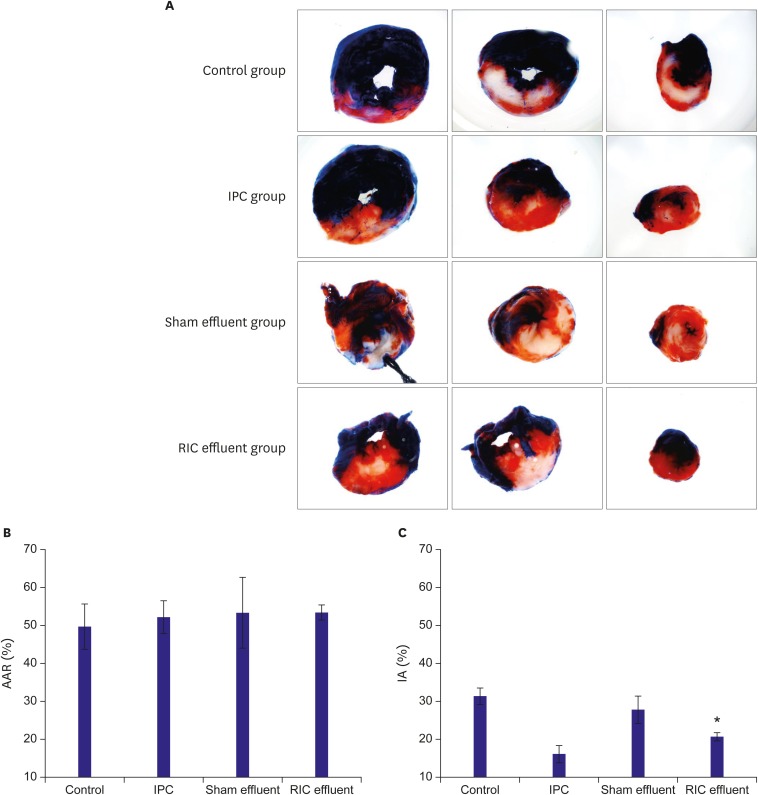
Figure 3.
Representative sections of TTC-stained hearts following ischemia for 30-minute and reperfusion for 60-minute. (A) Bar graph showing the AAR expressed as a percentage of total left ventricular area (B) and IA as a percentage of AAR (C). All data is expressed as mean±SEM. n=3 in each group.
AAR = area at risk; IA = infarct area; IPC = ischemic preconditioning; RIC = remote ischemic conditioning; SEM = standard error of mean; TTC = triphenyl-tetrazolium-chloride.
*p<0.050 vs. control group.

