Figure 3.
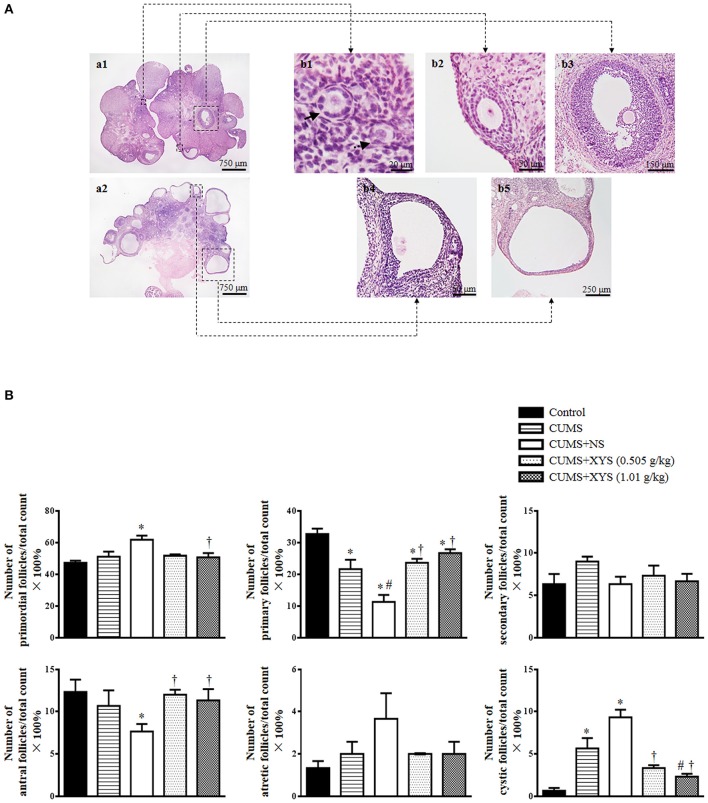
Effect of XYS post-treatment on follicle development of the ovary. (A) Representative HE staining images of rat ovarian tissue (a1,a2). The area within the rectangle in each image in left panel is enlarged and presented right, exhibiting the representative images of primordial follicle (b1, dotted arrow), primary follicle (b1, solid arrow), secondary follicle (b2), antral follicle (b3), atretic follicle (b4), and cystic follicle (b5), respectively. (B) Statistical result of the percentage of the follicles in different development stages in various groups. Results are presented as mean ± SE. *P < 0.05 vs. Control group; #P < 0.05 vs. CUMS group; †P < 0.05 vs. CUMS+NS group, n = 3.

