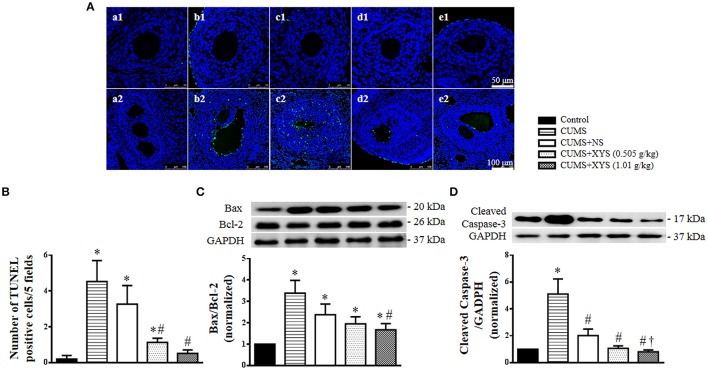
Figure 6.
Effect of XYS post-treatment on the apoptosis of granulosa cells in ovarian tissue. (A) Representative TUNEL staining images of secondary follicles (1), and antral follicles (2) in Control (a), CUMS (b), CUMS+NS (c), CUMS+XYS (0.505 g/kg) (d), and CUMS+XYS (1.01 g/kg) (e) group, respectively. TUNEL positive cells are stained green. (B) Statistical result of number of TUNEL positive cells per 5 fields. (C) Western blot for the expression of Bax and Bcl-2 in different groups with the quantification of Bax/Bcl-2 showing below. (D) Western blot for the expression of cleaved caspase-3 in different groups with the quantification of cleaved caspase-3 showing below. Results are presented as mean ± SE. *P < 0.05 vs. Control group; #P < 0.05 vs. CUMS group; †P < 0.05 vs. CUMS+NS group, n = 3 for TUNEL staining, n = 4 for western blot.

