Fig. 4.
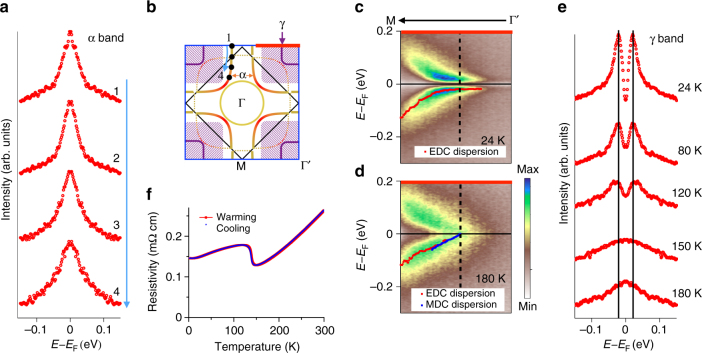
Temperature evolution of energy gaps. a Symmetrized EDCs at multiple kF positions of the α band at 30 K. b Schematic of the Fermi surface. The black dots indicate the kF positions of the symmetrized EDCs in a. c, d Spectra at 24 and 180 K. kF is indicated by the dashed line. The thick red line in b shows the position of the cuts in both c and d. The dots in the spectra are the EDC and MDC peak positions that sketch out the band dispersion. The band dispersions near EF flatten at 24 K but linearly disperse up to EF at 180 K. e Symmetrized EDCs at multiple temperatures. f Resistivity curve of La4Ni3O10. The resistivity anomaly at ~140 K is consistent with the energy gap filling in between 120 and 150 K

