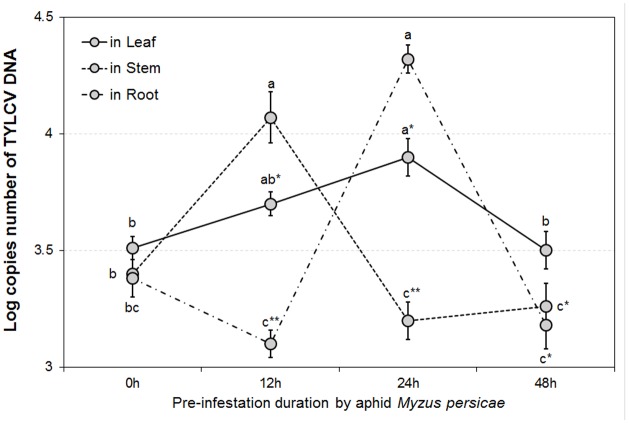
FIGURE 2.
TYLCV DNA concentrations in different tomato plant parts after feeding by TYLCV-infested Bemisia tabaci according to various Myzus persicae pre-infestation duration treatments. The error bars are standard errors of the mean. Colored letters indicate significant differences of DNA concentration among different aphid pre-infestation durations in each tomato plant part, and ‘∗’ indicates significant differences among three plant parts in the same pre-infestation duration according to Duncan’s test at P = 0.05.

