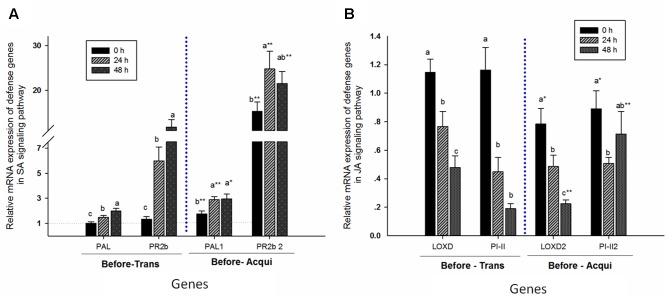
FIGURE 5.
Aphid pre-infestation duration effects on related defense genes in the SA- (A) and JA- (B) signaling pathways in tomato plants. The relative mRNA expression was calculated according to the 2-ΔΔCT method, and the y axis represents the level of change. The expression level of each target gene was first normalized to the quantity of SlActin and SlTub. The error bar represents the standard deviation calculated from three replicates. Letters indicate significant differences in relative expression among different aphid pre-infestation durations, and ‘∗’ indicates significant differences in the same aphid pre-infestation duration according to Duncan’s test at P = 0.05.

