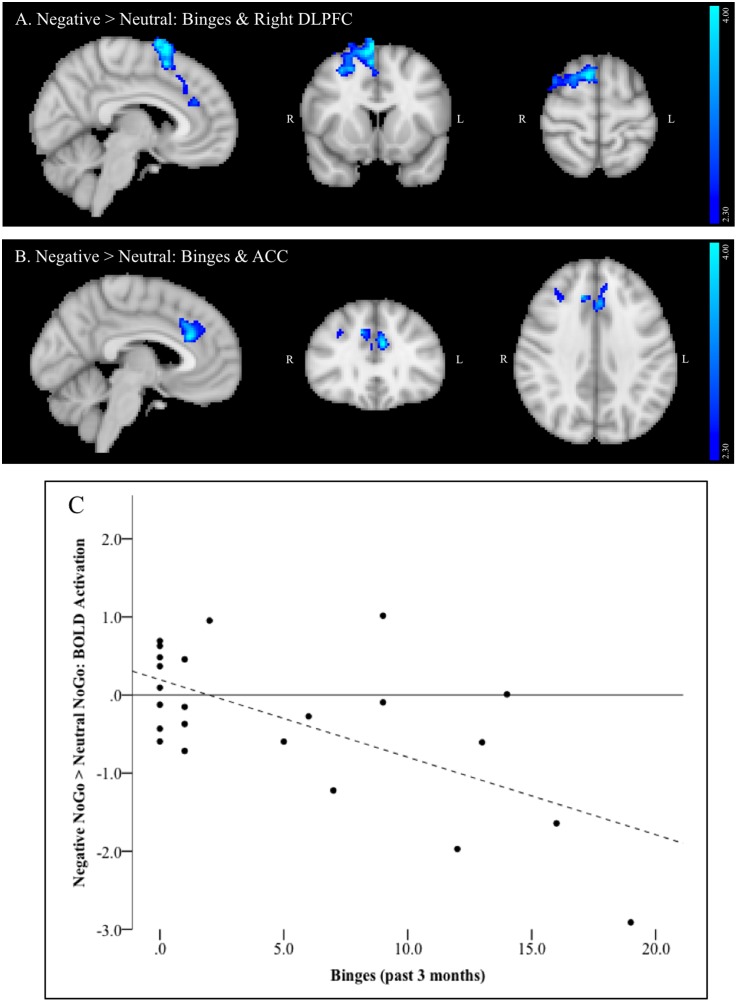
FIGURE 3.
(A–C) Region negatively associated with number of binges (past 3 months) in the negative NoGo versus neutral NoGo contrast. MNI co-ordinates: (A) x = 6, y = 12, z = 63; (B) x = –5, y = 30, z = 36; (C) Scatterplot of activation within this region (negative NoGo versus neutral NoGo contrast) versus number of binges (past 3 months).

