Figure 2.
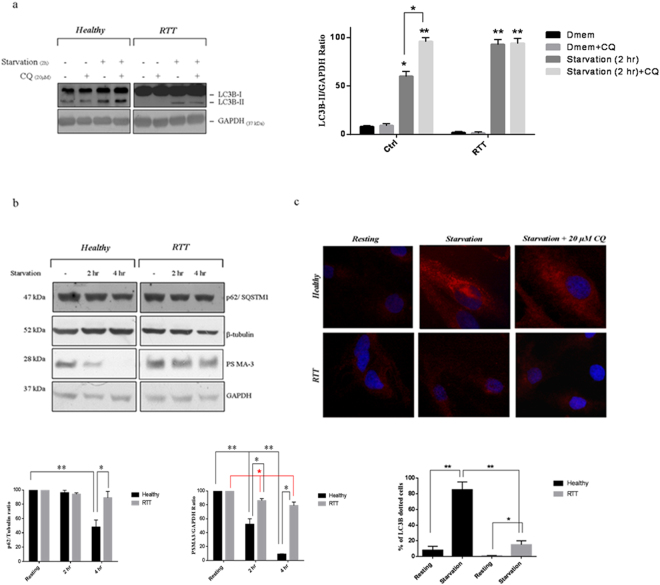
Defective autophagy activation in RTT fibroblasts. (a) WB analysis of RTT and healthy fibroblasts cultivated either in DMEM or starvation medium (2 h) in the presence or absence of 20 µM of CQ (upper panel). Filters were probed with an anti-LC3B or an anti-GAPDH antibody. A representative immunoblot of three independent experiments performed on the cell lines available (n = 4 for both the healthy and the RTT fibroblasts) is reported. Densitometric determination of LC3B to GAPDH content was performed by ImageJ software (lower panel). Results are the means ± S.E. of three independent experiments. Differences between the different experimental conditions in the same group are significantly different (*p < 0.05; **p < 0.001, one-way ANOVA, followed by Tukey’s test, n = 32). (b) Healthy and RTT fibroblasts (n = 4 in both cases) cultivated in a starvation medium for 2 and 4 h in the absence of CQ were assayed for p62/SQSTM1 and PSMA-3 content by WB (upper panel). The average intensity of the band was normalized to that of β-tubulin (for p62) and GAPDH (for PSMA-3) by ImageJ software (lower panel). The image shown is representative of four independent experiments. Even though the viability of RTT fibroblasts at 4 h of starvation was already compromised (see Fig. 1), this time-point was necessary to follow degradation of p62 which is normally delayed32. The results are the means ± S.E. of four independent experiments performed in triplicate. *,**,*Significantly different from the specific (see bars) experimental condition (*,* p < 0.05; **p < 0.001 one-way ANOVA; followed by Tukey’s test, n = 24). (c) Immunofluorescence microscopy analysis of autophagy activation by healthy (upper panel) and RTT fibroblasts (lower panel) (n = 4 in both cases). Resting (left), starved (middle) and starved + 20 µM of CQ (right) cells were stained with an anti-LC3B antibody. Due to the low detection of autophagosomes under resting conditions, the cells positive for autophagy induction under starving condition were quantified as the percentage of those displaying at least 10 dots. The results are the means ± S.E. of three independent experiments. **Significantly different from the specific (see bars) experimental condition (*p < 0.001; **p < 0.005, Unpaired τ Student’s test, n = 24).

