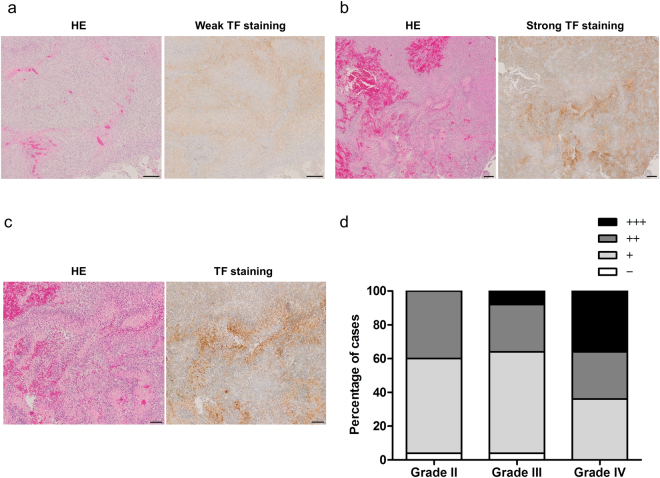
Figure 1.
Immunohistochemical staining of TF expression in glioma specimens performed using anti-TF 1849 mAb. (a,b) The left panels show HE staining and the right panels show TF staining with weak intensity (a) and strong intensity (b) in GBM. Scale bar, 200 µm. (c) High-power field of (b). HE staining (left panel) shows morphological findings of necrosis surrounded by pseudopalisading cells in GBM. TF was highly expressed in necrosis and pseudopalisading cells (right panel). Scale bar, 100 µm. (d) The level of TF was classified into four degrees: (−), negative; (+), <50% positive tumour cells; (++), ≥50% positive tumour cells with weak intensity; and (+++), ≥50% positive tumour cells with strong intensity. The percentages of the four categories in grade 2, 3 and 4 gliomas are shown. Each group consisted of 25 cases.

