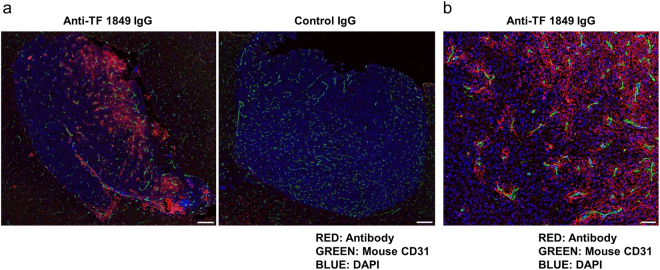
Figure 6.
Distribution of fluorescent antibodies in the intracranial tumour tissues. (a) The panels show the intracranial tumour tissues in the Alexa Fluor 647-labelled anti-TF 1849 IgG-administered mice (left panel) and Alexa Fluor 647-labelled control IgG-administered mice (right panel). In the fluorescent anti-TF 1849 IgG-administered group, the antibodies were observed in the intracranial tumour tissues. In contrast, in the fluorescent control IgG-administered group, the antibodies in the tumour tissues were hardly detectable. The Alexa Fluor 647-labelled antibodies, endothelial cells, and nucleus are indicated in red, green and blue, respectively. Scale bar, 200 µm. (b) High-power field of the tumour section in the Alexa Fluor 647-labelled anti-TF 1849 IgG-administered mice. Anti-TF 1849 IgGs were located on cell membranes of TF-overexpressing tumour cells around blood vessels. Scale bar, 50 µm.

