Figure 7.

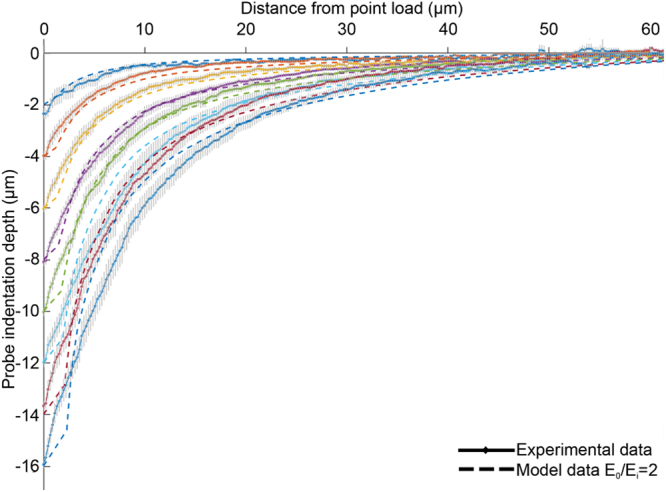
Comparison of surface deformation profiles between mean experimental data (solid lines) and numerical prediction (dashed lines) using E o = 140 kPa, E i = 70 kPa and v = 0.495. Each color represents and indentation depth.

Comparison of surface deformation profiles between mean experimental data (solid lines) and numerical prediction (dashed lines) using E o = 140 kPa, E i = 70 kPa and v = 0.495. Each color represents and indentation depth.