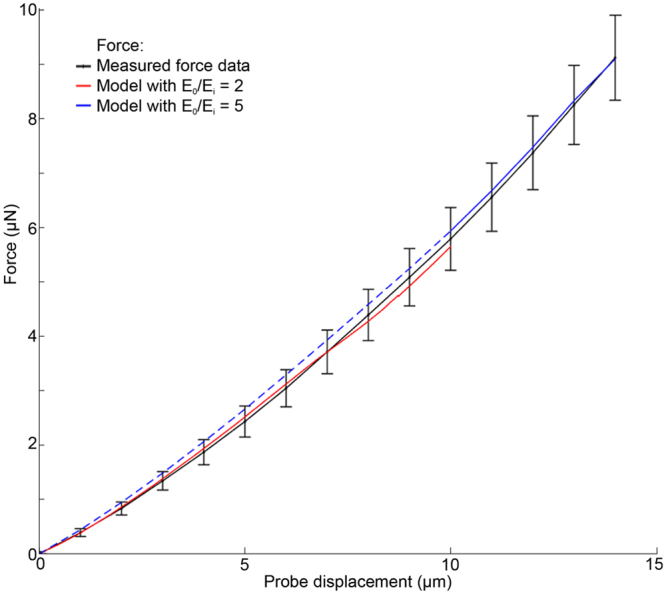
Figure 8.

Average force-displacement measurement (black line) using force-sensing microprobes, indenting the animal in a region close to the vulva either posteriorly or anteriorly (n = 9 animals). Computer simulation using an absolute E o and E i value of 140/70 kPa (red line) and 300/60 kPa (blue line) respectively to find a matching force-displacement curve to the mean of experimentally obtained measurements. Blue dashed line is 0–10 µm and blue solid line is 10–14 µm. Values are the averaged data ± s.e.m.
