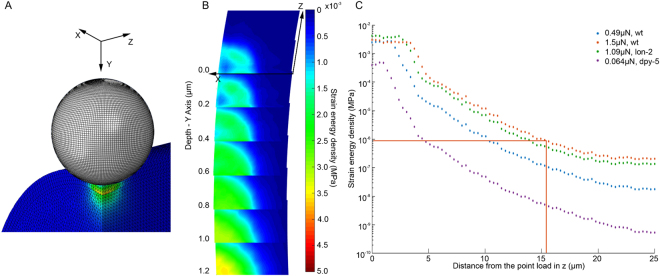
Figure 9.
(A) Finite element model of C. elegans body deformed by a 10 µm diameter sphere with a 0.49 µN stimulus. (B) A heat map distribution of SED at the receptor location (ie. 0.6 µm below surface) after 0.49 µN mechanical load. The y axis is the location of the probe as it was indented, while the z axis is the longitudinal and x axis transverse direction of the worm body. Each layer is a slice of 0.2 µm in depth (y axis) and the plane is 4 µm × 4 µm (x and z axis respectively). (C) At the depth of 0.5–0.7 µm where the neurites of the touch neurons reside the SED distribution along the length of the worm (z direction) within a ROI of 200 nm after force stimulation of 0.064 µN, 0.49 µN, or 1.09 µN with a 10 µm diameter probe or 1.5 µN with a 15 µm diameter probe (red line) respectively.

