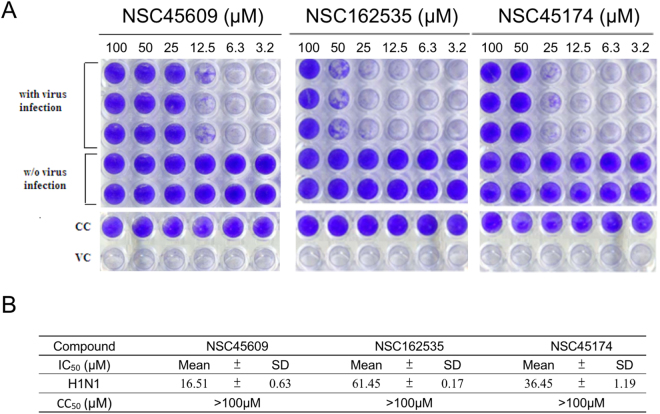
Figure 8.
Effects of influenza virus in cytopathic effect inhibition assays of novel inhibitors. (A) Infection of MDCK cultured cells with influenza viruses was conducted in the presence of different inhibitor concentrations. The cells are stained with crystal violet after incubation. The presence of the blue color indicates living cells without the viral infections. Absence of blue color indicates the infecting virus causes lysis of the host cell. Virus control (VC) and cell control (CC) are listed as shown. Numbers above each well represents concentration of inhibitor used in µM. (B) The mean IC50 values of the inhibitors against H1N1 virus and the stare listed as shown. Experiments performed in triplicates with the standard of deviation for each mean listed in table.

