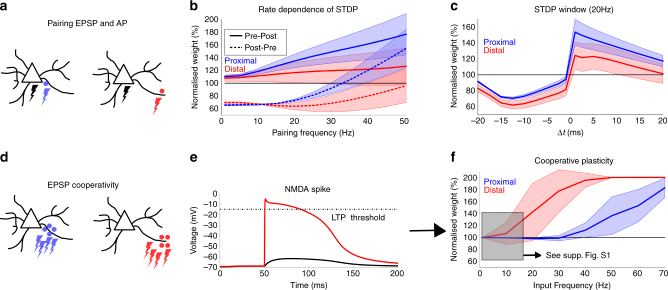
Fig. 2.
Plasticity gradient along basal dendrites. a Action potentials (black lightning) are paired with either proximal (blue) or distal (red) synaptic activations. b The pairing protocol as in Sjöström et al.23 is simulated. Action potentials and EPSPs are paired with a fixed interval of 10 ms, either pre–post (full lines) or post–pre (dashed lines). Five pairings at a fixed frequency are repeated 15 times (Methods section). The protocol is repeated for several pairing frequencies (horizontal axis) and the weight is displayed normalised to the initial value (vertical axis). The plasticity parameters were chosen to qualitatively reproduce the experimentally observed rate-dependence. Distal synapses show less potentiation due to the attenuation of the bAP. The solid lines are the means over all proximal (blue) or distal (red) compartments shown in Fig. 1a, the shaded regions are one s.d. c The same protocol as in b is repeated at a pairing frequency of 20 Hz, but the interspike interval is now varied (horizontal axis). The weight is normalised to the initial value (vertical axis) and shows the standard STDP window, where the potentiation at distal synapses is reduced compared to proximal synapses due to the attenuation of the bAP. The solid lines are the means over all proximal (blue) or distal (red) compartments shown in Fig. 1a, the shaded regions are one s.d. d A group of synapses on a proximal compartment (blue) or distal compartment (red) are activated by a Poisson process. e Distal groups of synapses can elicit NMDA spikes (red trace), which cross the LTP threshold of the plasticity model and can therefore result in potentiation while remaining sub-threshold in the soma (black trace). f When activating the synaptic groups as described in d, LTP is observed at much lower average activation rates for the distal group (red trace) compared to the proximal group (blue trace). This dLTP compensates for the lack of potentiation by STDP b, c. The solid lines are the means over all proximal (blue) or distal (red) compartments shown in Fig. 1a, the shaded regions are one s.d. Supplementary Fig. 1 shows distal depression at low rates (black shaded region) more clearly

