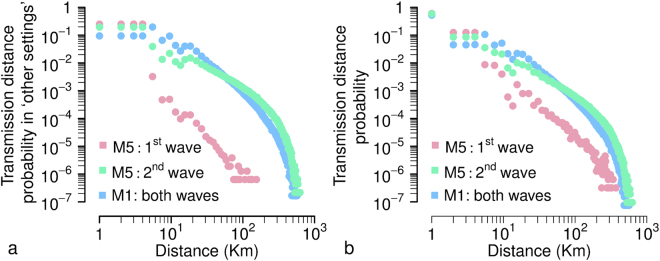
Figure 1.
Transmission distance. (a) Probability distribution of transmission distance in ‘other settings’ as estimated by model M5 for the two influenza waves and by model M1 for both waves combined together (results separated by wave for M1 are reported in Supplementary Information). Note that the transmission distance depends on both kernel function and population density (which is responsible for the bumps in the curves). The curves were obtained by averaging over 100 simulations run by using median values of the posterior distributions of model parameters; distances have been grouped in 1 km intervals and displayed at the superior limit of the intervals, so that for instance 1 on the x-axis corresponds to secondary infections occurring between 0 km (e.g., infection between members of the same household) and 1 km. (b) Probability distribution of transmission distance (i.e., accounting for infections occurring in all settings).

