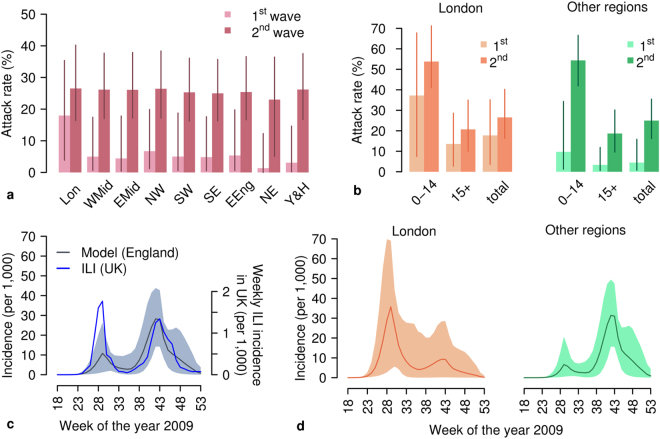
Figure 2.
Spatiotemporal dynamics of 2009 H1N1 influenza pandemic in England. (a) Estimated attack rate (mean and 95%CI) by region of England at the end of the two epidemic waves as resulting from model M5. Abbreviations used are: Lon, London; WMid, West Midlands; EMid, East Midlands; NW, North West; NE, North East; SW, South West; SE, South East; EEng, East of England; Y&H, Yorkshire & Humber. (b) Estimated attack rate by age (mean and 95%CI) in London and in all other England regions at the end of the first wave and at the end of the second wave as resulting from model M5. (c) Weekly incidence of new reported ILI cases in the UK12 and weekly incidence of new infections estimated by simulating the calibrated model M5 (mean and 95%CI) for England. Note that the comparison can be considered representative for the timing of the epidemic only, and not for the absolute magnitude of incidence, as: i) ILI cases refer to the entire UK, and ii) they are affected by underreporting (which was estimated to be remarkably lower during the first epidemic wave13,38, than in the second one). (d) Weekly incidence of new infections in London and in all other regions of England (grouped together) as estimated by model M5 (mean and 95%CI).

