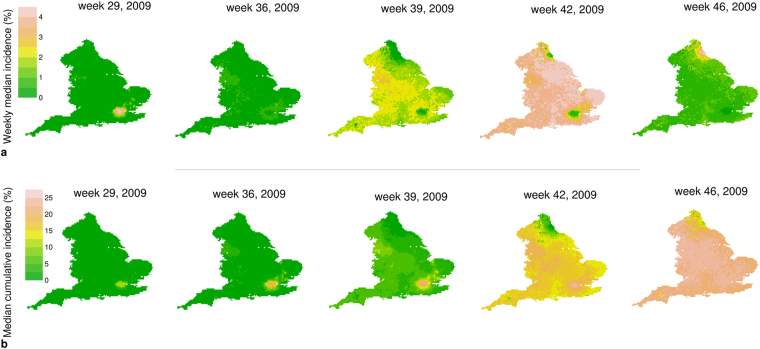
Figure 3.
Simulated geographic spread of 2009 H1N1 influenza pandemic in England. (a) Simulated weekly incidence of new infections in each single cell (median over 2,000 simulations) as resulting from model M5. (b) Simulated cumulative weekly incidence of new infections in each single cell (median over 2,000 simulations) as resulting from model M5. The maps were generated using Grass GIS 6.4.2 (https://grass.osgeo.org/announces/announce_grass642.html).

