Figure 1.
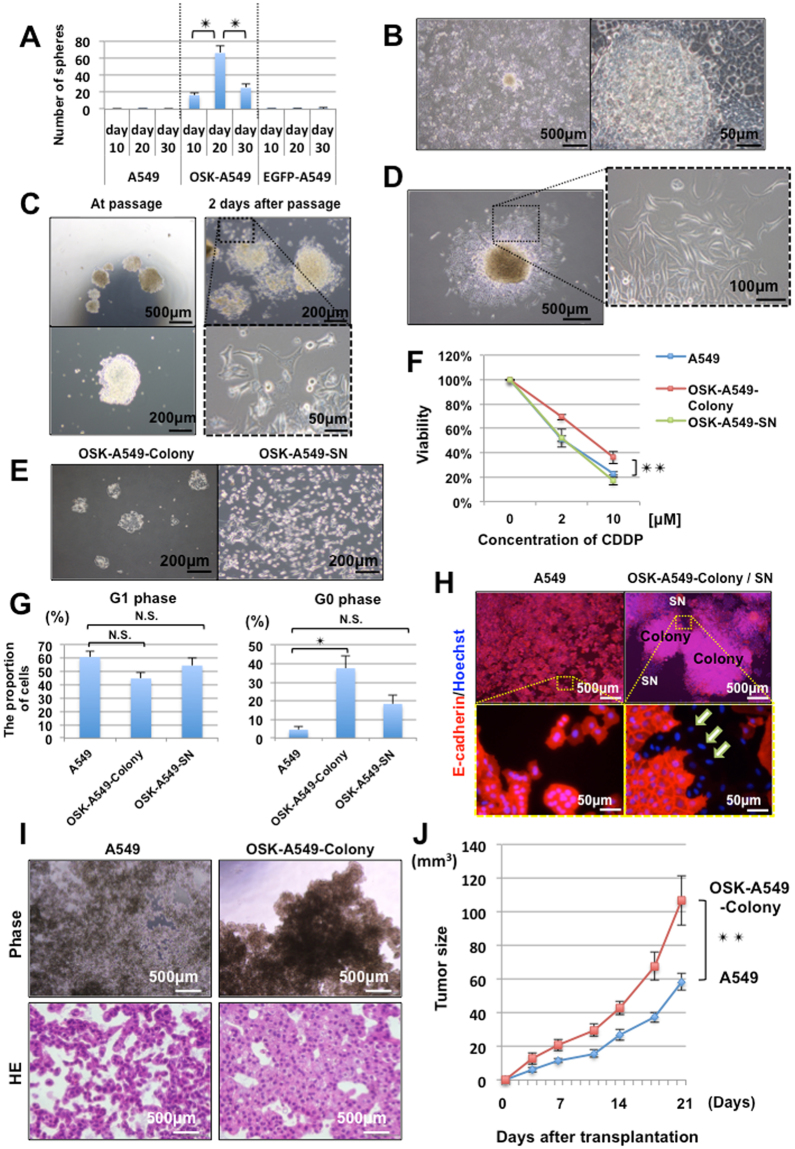
The induction of lung cancer stem-like cells and their characteristics. (A) A comparison of the sphere formation ability. (n = 3, *P < 0.05, Bonferroni test). (B) Dome-shaped colonies appeared in OSK-A549 cells at 10 to 15 days after the transduction of OSK. (C) Pictures of the colonies taken during passaging (left panels) and at 2 days after passaging (right panels). Spindle-shaped colonies cells appeared around the colonies after passaging. (D) The passaged colonies grew larger and gave rise to various cell phenotypes; most of the cells were spindle-shaped. (E) The cellular morphology of the OSK-A549-Colony cells (left panel), and OSK-A549-SN cells (right panel). After trypsinizing the OSK-A549-Colony cells for approximately 6 minutes, only the spindle-shaped cells around the colonies were detached; we collected them as supernatant cells (SN cells). (F) Chemoresistance among the A549, OSK-A549-Colony, and OSK-A549-SN cells following 3 days of cisplatin (0, 2, 10 µM) treatment. (n = 3, **P < 0.01; repeated measures ANOVA). (G) The cell cycle was analyzed by flow cytometry based on Ki67 and Hoechst staining. (n = 3, *P < 0.05; Dunnett’s test). (H) Immunocytochemistry of E-cadherin and Hoechst staining in the parental A549 and OSK-A549-Colony/SN cells. E-cadherin-negative cells were found around the OSK-A549-Colony cells (indicated as white arrows). (I) Phase contrast microscopy of the spheres (upper panels) and HE staining images (lower panels). Phase contrast microscopy of the OSK-A549-Colony cells showed obvious cellular aggregation, but not the parental A549 cells on the 24-well low attachment plate. (J) A comparison of the tumorigenicity in vivo between the parental A549 and OSK-A549-Colony cells (n = 10, **P < 0.01; repeated measures ANOVA).

