Figure.
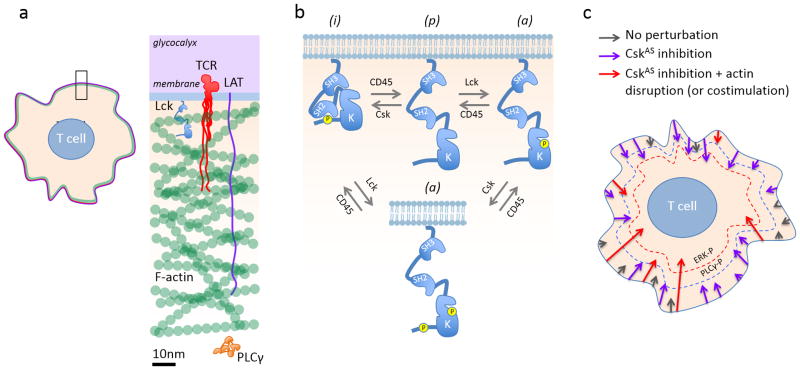
Effects of Csk inhibition and actin disruption on TCR signaling. (a) The actin cortex forms a physical barrier between the membrane and the rest of the cytoplasm. Only the F-actin part of the cortex is shown. The proteins are drawn to scale; the TCR/CD3 and LAT cytoplasmic domains, even at the theoretical length maximum (~3.5Å/residue), are occluded by the actin cortex. (b) Role of Csk in Lck regulation. The active (a), inactive (i) and ‘primed’ (p) isoforms of Lck interconvert via Csk- and Lck auto-phosphorylation, and via CD45-mediated dephosphorylation (re-drawn from ref 4). (c) Signaling thresholds and the effects of global receptor perturbation. Signaling cascades initiated by Lck-mediated phosphorylation of individual TCRs in the resting state are represented by arrows of varying length: basal signaling, grey; CskAS inhibition-initiated signaling (purple); CskAS inhibition- and actin disruption-initiated signaling (or costimulation, red). Arrow length corresponds to the depth of the signaling cascade reached. For a given condition the lengths of the arrows vary, reflecting stochastic effects. The blue and red dashed lines symbolize signaling thresholds corresponding to PLCγ (PLCγ-P) and ERK (ERK-P) phosphorylation. In the unperturbed cell, the signaling cascades reach neither threshold. CskAS inhibition is likely to globally enhance Lck activity and TCR phosphorylation, increasing the number of signaling cascades and the probability that one or more cascades breaches the threshold required for PLCγ phosphorylation. ERK phosphorylation also requires actin disruption, enhancing PLCγ access to substrates in the membrane.

