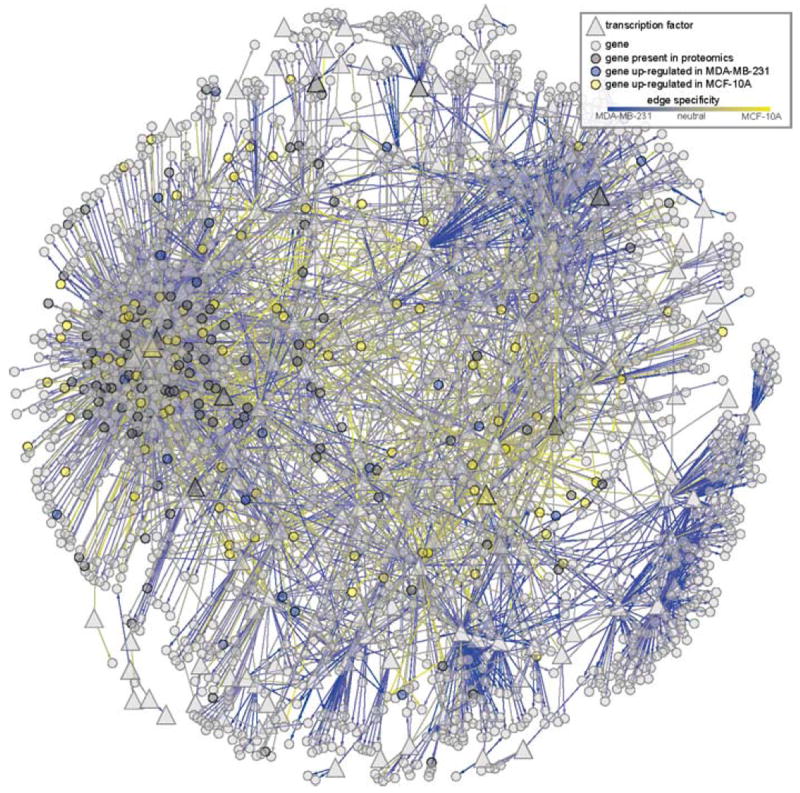
Fig. 4.

Breast cancer network with the top 4822 edges ranked by combined confidence from the two cell line inference runs. Edge color denotes differential inferred regulation on a yellow-to-blue gradient from MCF-10A (yellow) to MDA-MB-231 (blue). Nodes are rendered semi-transparent so that the distribution of cell-line-specific regulatory edges can be clearly seen. Proteomics data from MCF-10A/MDA-MB-231 comparison are also shown using node colors: differential expression in MCF-10A is shown in yellow, and MDA-MB-231 in blue. Genes present but not differentially expressed are shown in darker gray. (See color plate)
