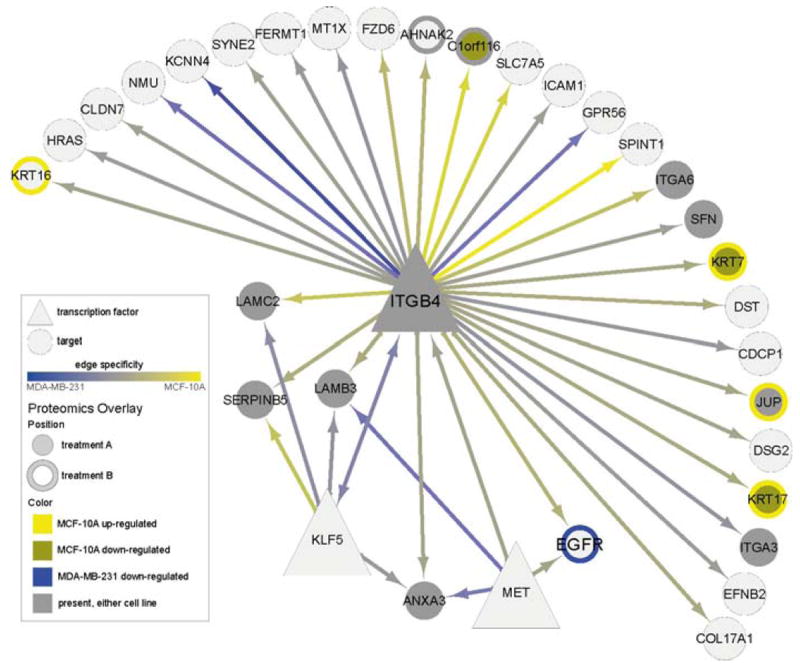
Fig. 6.

A sub-network extracted from the cell line comparison network illustrating all interactions with ITGB4 along with overlays of experimental proteomics (SILAC) data. Shown is the 1-hop network from gene ITGB4 along with differential expression in two experimental conditions, referred to as treatment A and treatment B. ITGB4 was identified a priori as a gene of interest, and is inferred to regulate gene of interest EGFR and several Laminins. Differential expression in treatment A is shown using node center, and in treatment B using node border, as follows: bright yellow denotes upregulation in MCF-10A, bronze denotes downregulation in MCF-10A, and blue denotes downregulation in MDA-MB-231. Gray denotes proteins that were present in either cell line but that did not meet the differential expression cutoff. Therefore, KRT17 (bottom right) is downregulated in MCF-10A with treatment A but upregulated in MCF-10A with treatment B, while EGFR is downregulated in MDA-MB-231 with treatment B. Edge colors are as in Fig. 5. (See color plate)
