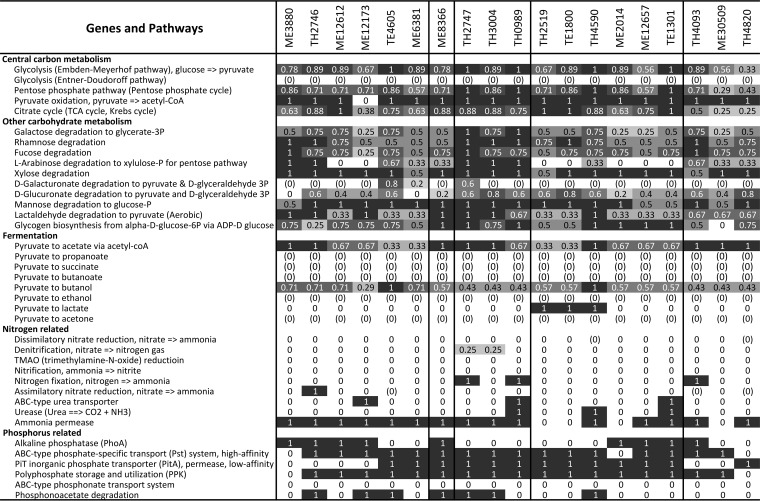
FIG 6 .
Completeness estimates of key metabolic pathways. Data were shaded in grayscale according to the value, with “1” shaded with the darkest color (black) and “0” with the brightest color (white) to highlight the difference. A completeness value of “1” indicates that a pathway is complete; “0” indicates that no genes were found in that pathway; and “(0)” indicates that, although some genes in a pathway were present, the pathway was likely absent both because signature genes for that pathway were not found in that draft genome and because signature genes were missing in more than two-thirds of all draft genomes.

