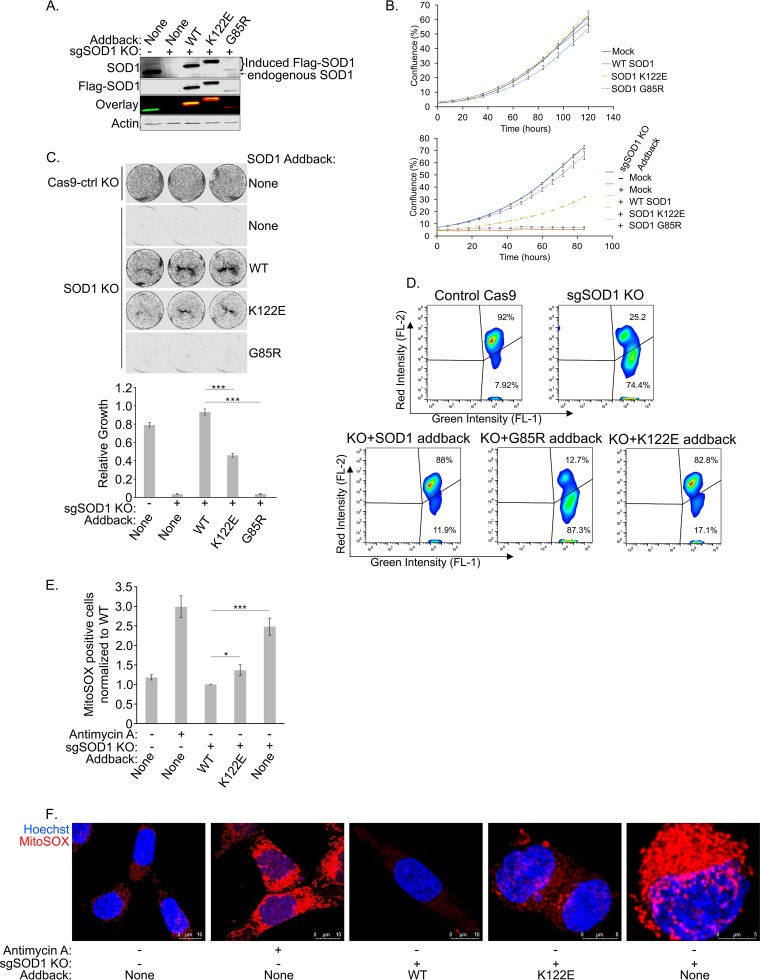
FIG 7.
The SOD1 K122E acyl mimic is impaired in its ability to rescue the lethality of SOD1 deletion and reduce mitochondrial ROS levels. (A) Endogenous SOD1 was knocked out of HCT-116 T-REx cells using the CRISPR-Cas9 system. Expression of Flag-tagged SOD1 (with a mutated PAM site) was induced in the T-REx cells with doxycycline. The cells were lysed and were subjected to SDS-PAGE before being immunoblotted for endogenous SOD1 and overexpressed Flag-tagged SOD1. (B) (Top) SOD1 HCT-116 T-REx cells were seeded in 24-well plates and were grown in the absence of doxycycline. Cell confluence was measured by an IncuCyte Zoom system. Four technical replicates were carried out. Error bars represent SEM. (Bottom) Endogenous SOD1 was knocked out as described for panel A. Cells were plated and analyzed as described directly above but were grown in the presence of doxycycline. (C) After knockout of endogenous SOD1 and overexpression of Flag-tagged SOD1, the HCT-116 T-REx cells were seeded at 22,500 per well and were allowed to grow for 4 days before being fixed and stained with Giemsa stain. The wells were then imaged and quantified. Three technical replicates were carried out. Asterisks indicate significant differences (***, P < 0.001). (D) Cells prepared as for panel B (bottom) were stained with JC-1 to measure mitochondrial membrane potential. A live-cell population was gated from forward scatter and side scatter measurements, and FL-1 was plotted against FL-2. A higher FL-2/FL-1 ratio indicates a higher (healthier) mitochondrial membrane potential. (E) Cells prepared as for panel B (bottom) were stained with MitoSOX Red to measure mitochondrial superoxide content. A live-cell population was gated from forward scatter and side scatter measurements, from which a population of singlets was identified and selected. A threshold for positive MitoSOX staining was set based on the unstained control, and a ratio of BL-3-positive cells to singlets was calculated and normalized to WT addback cells. A higher ratio indicates a larger proportion of cells with superoxide present. Four replicates were carried out. Asterisks indicate significant differences (*, P < 0.05; ***, P < 0.001). (F) Cells prepared as for panel B (bottom) were stained with 5 μM MitoSOX Red for 10 min, and nuclei were counterstained. Prior to MitoSOX staining, positive-control cells were treated with 30 μM antimycin A for 40 min.

