FIG 3.
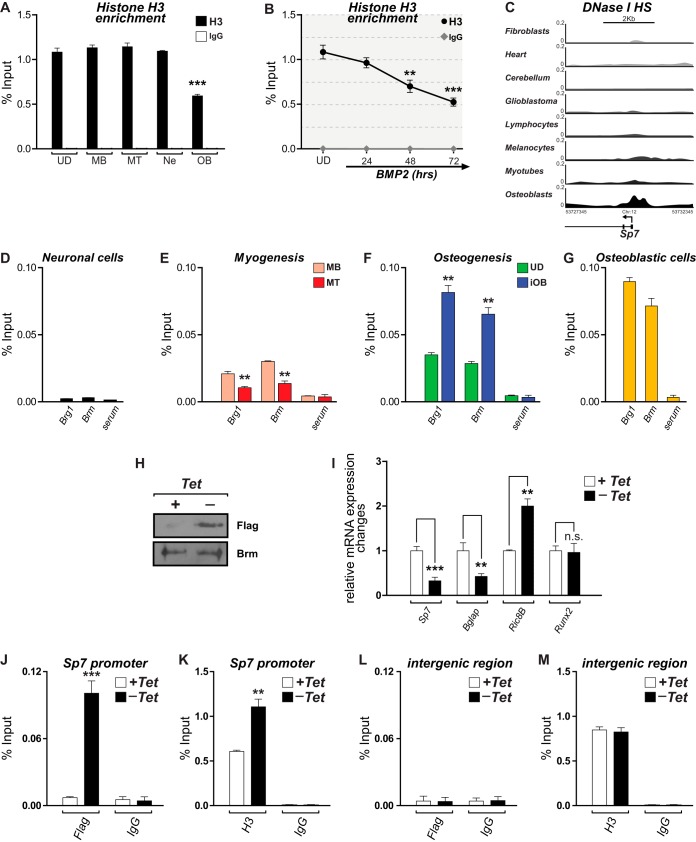
Reduced histone H3 enrichment and SWI/SNF-dependent chromatin remodeling at the Sp7 promoter accompany Sp7 expression in osteoblasts. (A and B) Histone H3 enrichment at the proximal promoter region of the Sp7 gene determined by ChIP of chromatin samples obtained from the indicated cell types (A) as well as from UD cells incubated with BMP2 for up to 72 h (B). See the legend to Fig. 1 for an explanation of cell types and symbols. (C) DNase I hypersensitivity (DNase I HS) profiles at the Sp7 gene promoter in different human cell types obtained from the ENCODE public database. Profiles are shown as the density of DNase I cleavage signals. (D to G) ChIP analyses to detect binding of the SWI/SNF catalytic subunits Brg1 and Brm to the proximal promoter region of the Sp7 gene in the different cell types. (H) Western blot analyses showing the expression of the Flag-tagged Brm mutant protein (Brm-NTP) in the ROSBrmTA osteoblastic cell line grown in the presence (+) or absence (−) of tetracycline (Tet) for 3 days. Blots were revealed by using specific anti-Flag (top) or anti-Brm (bottom) antibodies. (I) Sp7, Bglap, Ric-8B, and Runx2 mRNA expression levels in ROSBrmTA cells grown in the presence and absence of tetracycline. mRNA levels were measured by RT-qPCR and are shown as values relative to the expression level of each gene in the presence of tetracycline, normalized to the level of Gapdh. (J and K) Binding of the Flag-tagged mutant Brm protein (J) and enrichment of histone H3 at the Sp7 promoter (K) were determined by ChIP of samples from cells grown in the presence or absence of tetracycline. (L and M) Evaluation of an unrelated genomic region, devoid of known regulatory sequences (96), as a control. ChIP values and statistical significance were determined as described in the legend of Fig. 1. Data represent means ± standard errors of the means (n ≥ 3). *, P ≤ 0.05; **, P ≤ 0.01; ***, P ≤ 0.001 (as determined by Student's t test).

