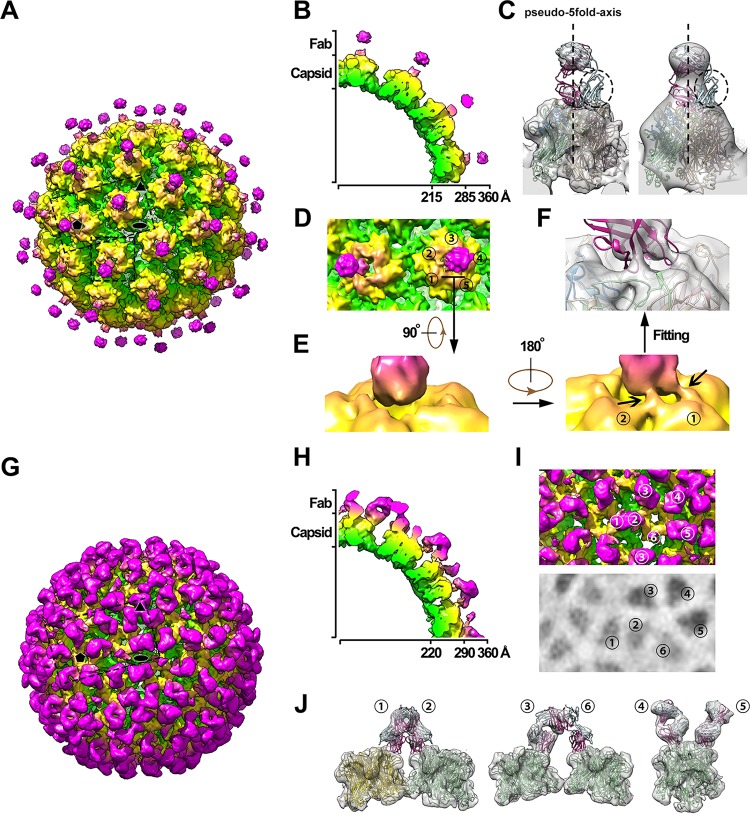
FIG 4 .
Cryo-EM structures of the VLP-Fab complexes of HPV58v:A12A3 and HPV59v:28F10. (A and G) Overall density maps of HPV58v:A12A3 (A) and HPV59v:28F10 (G) colored by radius from green (230 Å), to yellow (280 Å), to hot pink (320 Å). Icosahedral 2-, 3-, and 5-fold axes are indicated by black symbols. (B and H) Cross-sections of one-quarter of the cryo-EM map of HPV58-A12A3 (B) and HPV59-28F10 (H). (C) Density corresponding to one pentamer complexed with A12A3 Fab and the fitted crystal structure of HPV58p:A12A3. The 25-Å low-pass filtered map is shown on the right. The pseudo-5-fold axis is represented by a dotted line, and the broken circles outline the region in the crystal structure where the attributed density was missing. (D) Magnified view of the boxed area in panel A, including the 5-coordinated pentamer and one of its neighboring 6-coordinated pentamers. The number denotes five different monomers of the 6-coordinated pentamer. (E) Close-up view of the interaction region between A12A3 and HPV58 capsid denoted in panel D. (F) The same density in panel E is shown in semitransparent gray and superimposed with the crystal structure of HPV58p:A12A3. (I) Magnified view of the boxed area in panel G. The number indicates six different monomers within one icosahedral asymmetric unit. The lower panel shows the radial projection of the complex map at 310-Å radii, which indicates the density intensities on the Fabs bound to different monomers. (J) The density map of a pentamer with different Fabs in an icosahedral asymmetric unit was extracted and is superimposed with the crystal structure of HPV59p:28F10.

