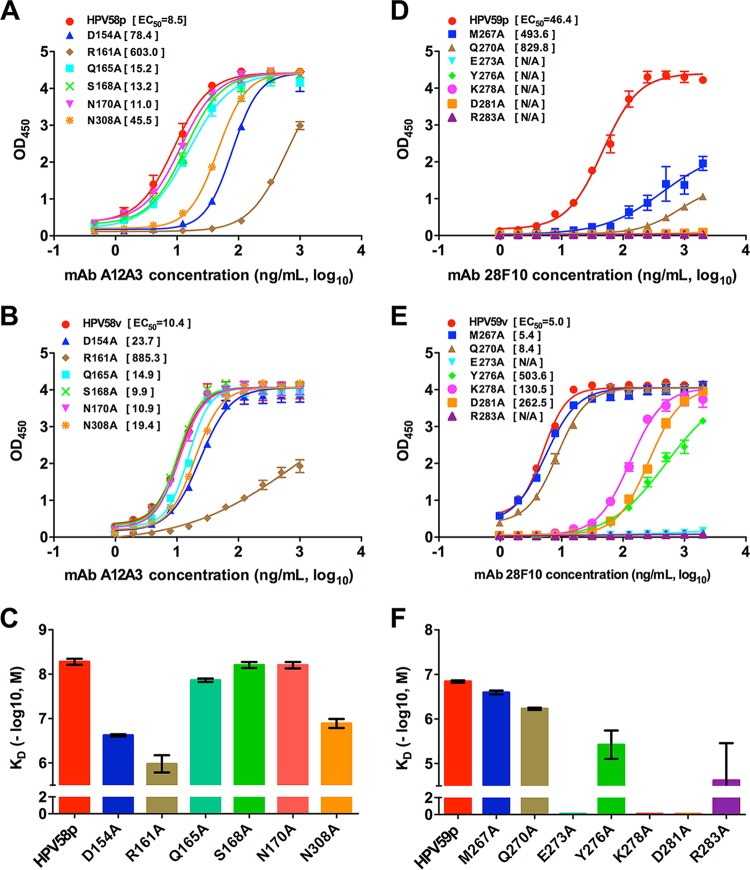
FIG 5 .
Effect of the interface residues on binding of MAbs A12A3 and 28F10. (A and D) Binding profiles of MAbs A12A3 and 28F10 to the mutant and WT HPV58 pentamer (A) and HPV59 pentamer (D), respectively. (B and E) Binding profiles of MAbs A12A3 and 28F10 to the mutant and WT HPV58 VLP (B) and HPV59 VLP (E), respectively. (C and F) Affinity constants of MAbs A12A3 and 28F10 to the mutant and WT HPV58 pentamer (C) and HPV59 pentamer (F), respectively. The vertical axis represents −log10 molar concentration of the equilibrium dissociation constant (KD). The color schemes for trace curves and histograms within HPV58 or HPV59 are the same.

