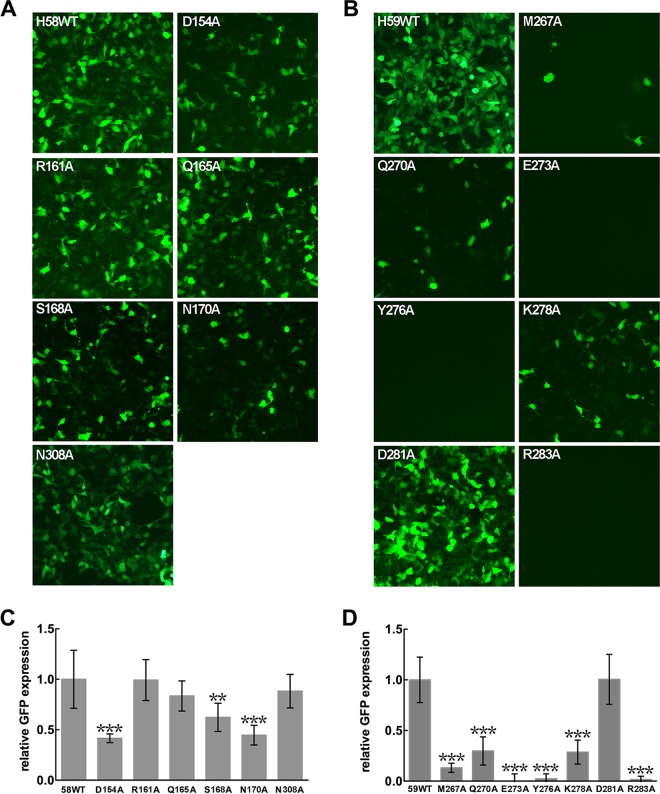
FIG 6 .
Infectivity of mutant pseudoviruses (PsVs). (A and B) HaCaT cells were infected with equal amounts of WT and mutant PsVs of HPV58 (A) and HPV59 (B). Expression of GFP was visualized using a fluorescence microscope. Panels C and D demonstrate the fluorescence intensities in panels A and B, respectively. Intensities were quantified from 10 randomly selected views using ImageJ, and the relative expression of the mutant PsVs to the cells infected with WT PsVs is plotted as the mean ± standard deviation (SD). Results were analyzed by unpaired Student’s t test. Differences were considered statistically significant at P ≤ 0.05 (not shown), P ≤ 0.01 (**), or P ≤ 0.0001 (***).

