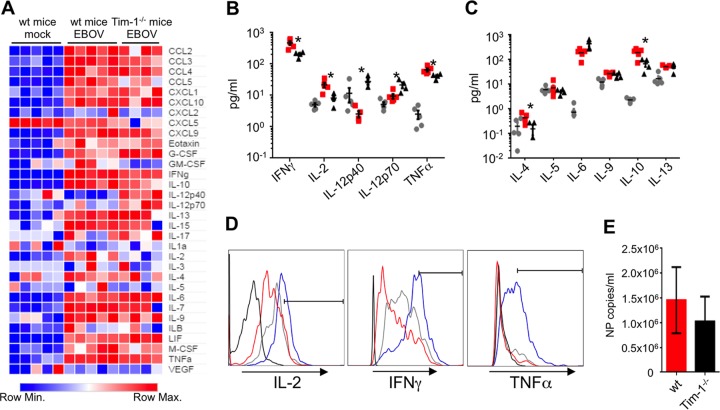
FIG 2 .
Tim-1−/− mice exhibit reduced Th1/2 responses. Serum cytokines/chemokines, CD4+ T-cell functional responses, and plasma viremia levels were analyzed 6 days following EBOV infection. (A) Heat map representing global variations in cytokine/chemokine responses in wild-type C57BL/6J mice and Tim-1−/− as determined by multiplex analysis. G-CSF, granulocyte colony-stimulating factor; LIF, leukemia inhibitory factor; M-CSF, macrophage colony-stimulating factor; VEGF, vascular endothelial growth factor. (B and C) Graphical representation of Th1-associated (B) and Th2-associated (C) cytokines. Gray circles, mock-infected wild-type mice; red squares, EBOV-infected wild-type mice; black triangles, Tim-1−/− EBOV-infected mice. (D) Intracellular cytokine staining for IL-2, IFN-γ, and TNF-α in gated CD4+ CD3+ T cells. Black line, isotype control, an EBOV-infected wild-type mouse; red line, a mock-infected wild-type mouse; gray line, an EBOV-infected wild-type mouse; blue line, an EBOV-infected Tim-1−/− mouse. (E) Plasma viremia levels were determined by quantitative PCR. Histograms of cells are representative of individual mice within each group. Plasma viremia is shown by the mean number ± SE of NP copies from 5 wild-type C57BL/6J mice and 4 Tim-1−/− mice infected with mouse-adapted EBOV. Asterisks denote statistical significances between the mean averages for wild-type mice and Tim-1−/− mice, where P is <0.05 (Student’s t test).

