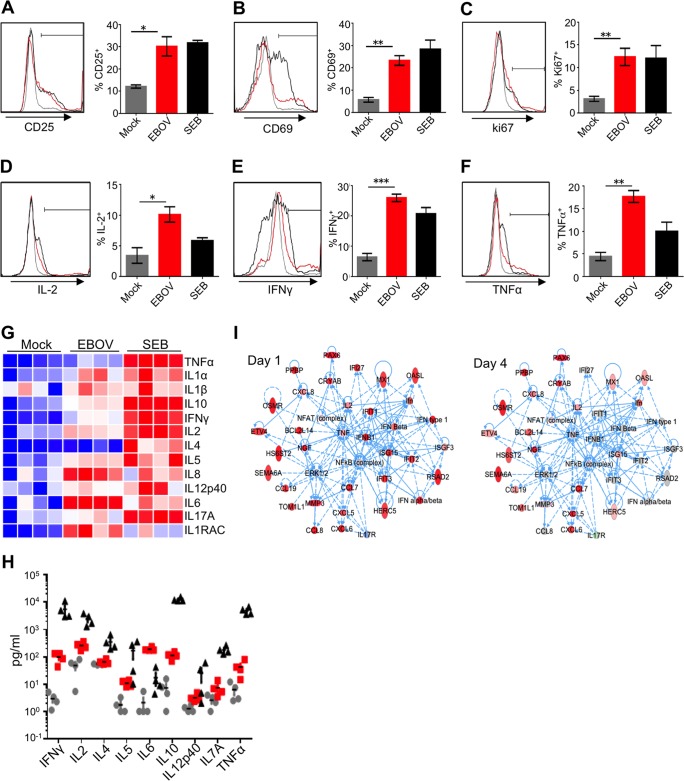
FIG 4 .
EBOV activates CD4+ T cells and induces the release of inflammatory mediators. (A to C) Expression levels of the activation markers CD25 (A), CD69 (B), and intracellular Ki-67 (C) as assessed by flow cytometry at 48 h after addition of EBOV to CD4+ T cells. (D to F) Intracellular cytokine staining for IL-2 (D), IFN-γ (E), and TNF-α (F) performed on primary CD4+ T cells at 48 h after the addition of EBOV at an MOI of 0.3; histograms of cells from representative donors and mean percentages of cells from 4 donors ± SE. Statistical significances between the mean percentages are shown as follows: *, P < 0.05; **, P < 0.01; ***, P < 0.001 (Student’s t test). (G and H) Heat maps and levels of cytokines (picograms per milliliter) associated with Th1, Th2, and Th17 responses in supernatants of EBOV-stimulated CD4+ T cells at 48 h after addition of EBOV. Heat maps in panel G are shaded as in Fig. 2A. Grey circles, red squares, and black triangles represent mock- (medium only), EBOV-, and SEB-stimulated cells, respectively. (I) Transcriptional profiling shows the coordinated upregulation in inflammation pathways indicative of a cytokine storm in CD4+ T cells on both day 1 and day 4 after addition of EBOV. Solid lines represent direct interactions, and dashed lines represent indirect interactions from IPA’s Knowledge Base. Expression data from EBOV-infected samples relative to mock samples at day 1 and day 4 are overlaid onto each gene, where red represents significant relative upregulation and blue represents significant relative downregulation.

