FIG 6 .
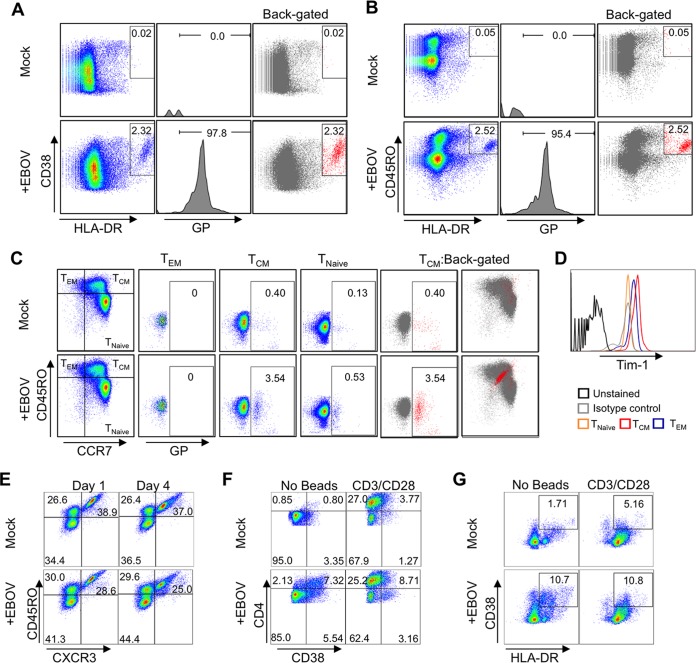
EBOV preferentially binds to TCM cells. (A) Activation of isolated CD4+ T cells by EBOV. Expression of HLA-DR versus CD38 (left panel). The EBOV GP+ population (middle panel) was back-gated on HLA-DR+ CD38+ flow cytometry plots (right panel) to determine correlation of GP binding with cell activation. (B) HLA-DR versus CD45RO staining used to determine if activated cells are derived from the naive (CD45RO−) or memory (CD45RO+) subsets. GP+ population (middle panel) was back-gated to HLA-DR+ CD45RO+ plots (right panel). (C) EBOV binding to TEM or TCM determined following staining for CCR7 versus CD45RO. GP binding for each of the 3 quadrants corresponding to TEM, TCM, and naive cells is shown. GP+ cells were back-gated to CCR7+ CD45RO+ plots for TCM quadrant (right panel). (D) Tim-1 expression profile on T-cell subsets. (E) Analysis of Th subsets in primary CD4+ T cells following 1- and 4-day-long stimulation with EBOV. Percentages of naive (CD45RO−), Th2/17 (CD45RO+ CXCR3−), and Th1 (CD45RO+ CXCR3+) cell populations. (F) Analysis of CD4Hi CD38+ T cells after 4-day-long stimulation with EBOV, CD3/CD28 beads, or both EBOV and CD3/CD28 beads. (G) Analysis of HLA-DR+ CD38+ T cells at 4 days following stimulation with EBOV, CD3/CD28 beads, or both EBOV and CD3/CD28 beads. Data in all panels are representative of 1 of 2 independent donors and experiments performed in triplicate wells.

