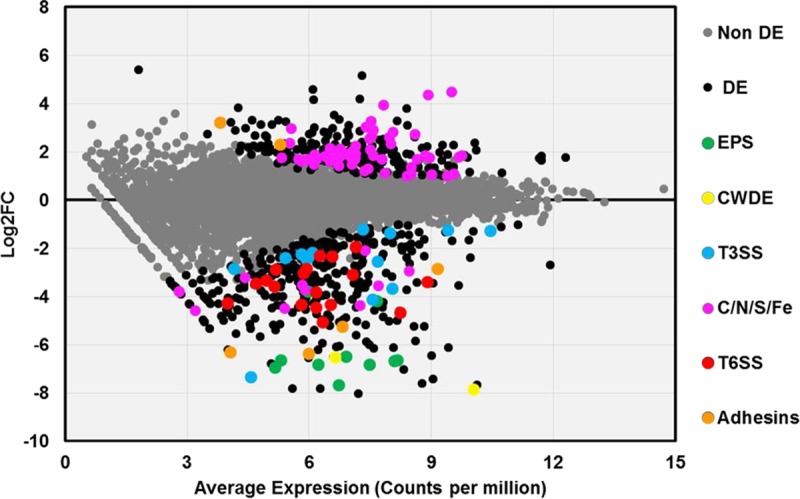
FIG 2 .

Expression levels of PhcA-responsive genes in planta. A scatter plot shows the relationship between the average transcript expression level and log fold change (log2FC) for each coding sequence in the R. solanacearum genome, based on sequencing of RNA extracted from stems of tomato plants infected with either wild-type or ΔphcA bacteria. Log2FC data represent log2-transformed values corresponding to reads per kilobase of million mapped reads (RPKM) of the ΔphcA mutant versus the wild type. Each circle represents a single coding sequence; black circles indicate genes that are differentially expressed (DE) at a false discovery rate (FDR) of ≤0.005; gray circles indicate non-DE genes. Colored circles indicate DE genes encoding traits of interest: green, extracellular polysaccharide (EPS); yellow, plant cell wall-degrading enzymes (CWDE); blue, structural proteins and effectors of the type III secretion system (T3SS); pink, uptake or catabolism of carbon, nitrogen, sulfur, or iron sources (C/N/S/Fe); red, type VI secretion system (T6SS); orange, hemagglutinin-like proteins and adhesins.
