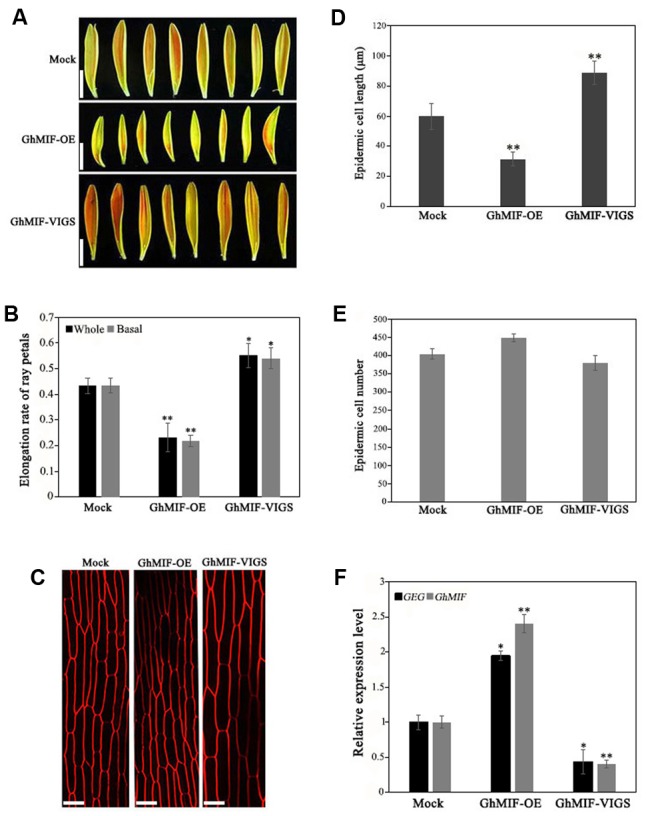
FIGURE 3.

Overexpression and silencing of GhMIF in Gerbera hybrida petals. (A) Ray petal phenotypes and determination of (B) the whole and basal ray petal elongation rate. (C) Epidermal cell images of mock controls, GhMIF-OE and GhMIF-VIGS lines. (D) Cell length and (E) cell number of mock controls, GhMIF-OE and GhMIF-VIGS lines. (F) The expression level of GhMIF and GEG in mock control, GhMIF-OE and GhMIF-VIGS petals. The experimental petals were collected after 8 days cultivation in growth conditions. All values indicate means ± SD from at least three biological replicates. Tukey’s HSD: ∗p < 0.05, ∗∗p < 0.01. Scale bars represents 1 cm (A) or 20 μm (C).
