FIGURE 4.

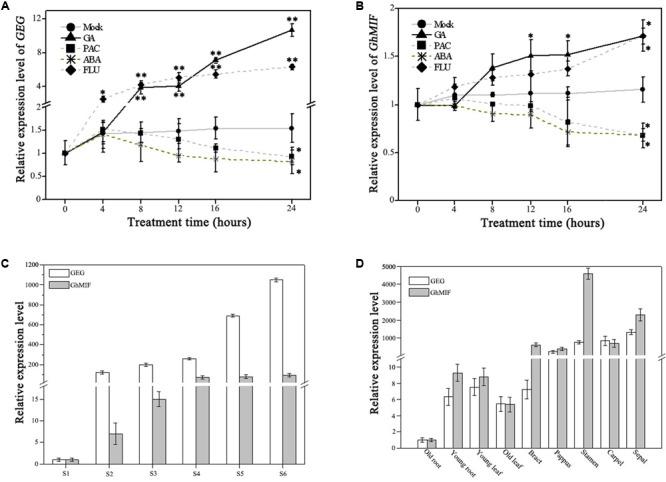
Expression analysis of GEG and GhMIF by qRT-PCR. Detection of the expression level of (A) GEG and (B) GhMIF in S5 ray petals under GA (gibberellic acid, 10 μM), ABA (abscisic acid, 50 μM), PAC (paclobutrazol, 10 μM), FLU (fluridone, 0.1 μM) and mock treatments at different time points (0, 4, 8, 12, 16, and 24 h). (C) Relative expression level of GEG and GhMIF during petal developmental phases (S1–S6, “S” represents “stage”) and (D) in different tissues and floral organs of the ray petals. GhACTIN (AJ763915) was used as an internal control. The experiment was repeated three times, the lowest expression in any tissue was set to 1.0, and the expression value indicates mean ± SD. The significant differences were evaluated by Tukey’ HSD test: ∗p < 0.05, ∗∗p < 0.01.
