
Fig. 1.
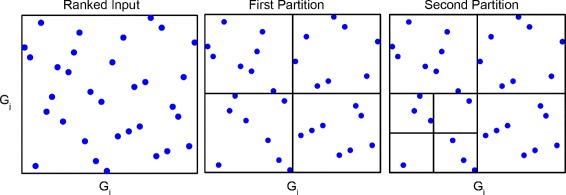
Adaptive partitioning schema to estimate mutual information. Each blue point represents one gene expression in one sample after ranking. X-axis and Y-axis represent 2 different genes. Boundaries are possible partitioning. Left plot shows the input data, middle plot shows the first partition, right plot shows a second partition