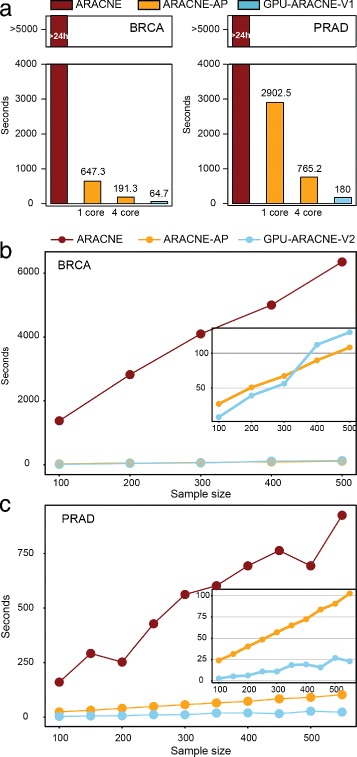
Fig. 4.

GPU-ARACNE speed benchmarking. a GPU-ARACNE-V1 performance. X-axis represents different algorithms/setting. Y-axis represents runtime in seconds. ARACNE runtime is truncated to show ARACNE-AP and GPU-ARACNE-V1 running time. Left plot shows result using 200 breast cancer samples, right plot shows result using 550 prostate cancer samples. b-c GPU-ARACNE-V2 performance. X-axis represents sample size; Y-axis shows the running time in seconds
