Figure 3.
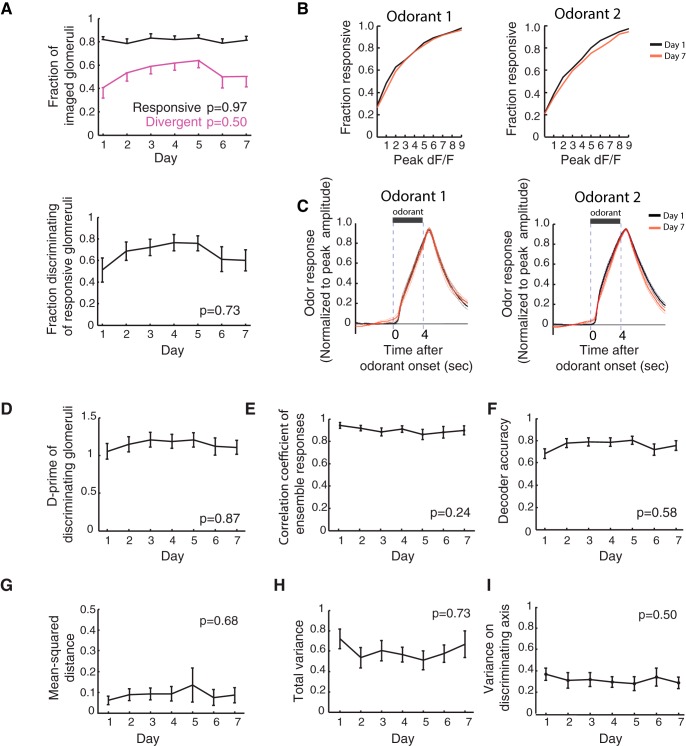
Glomerular odor representations do not show an increased separation during training. A, top, Fractions of glomeruli classified as responsive (black) and divergent (magenta) are plotted for each day. The responsive fraction and divergent fraction remain stable across days (Pearson correlation; responsive, p = 0.97; divergent, p = 0.50). Bottom, Fraction of divergent glomeruli out of all responsive glomeruli does not significantly change during training (Pearson correlation; p = 0.73). B, Cumulative fraction distributions of the peak amplitude of excitatory glomerular odorant responses on day 1 and day 7. There is no difference in the distributions for either odorant between day 1 and day 7 (Kolmogorov-Smirnov test: odorant 1, p = 0.64; odorant 2, p = 0.99). C, Mean excitatory glomerular odorant responses on day 1 (black) and day 7 (red), normalized to peak amplitude. There are no significant differences between responses on day 1 and day 7 (Wilcoxon rank sum test for each imaging frame, false-discovery rate corrected: q = 0.05). D, The averaged d-prime of all divergent glomeruli does not change with difficult discrimination training (Pearson correlation; p = 0.87). E, The correlation coefficient between averaged ensemble odorant responses does not change with difficult discrimination training (Pearson correlation; p = 0.24). F, The decoder accuracy does not change during difficult discrimination training (Pearson correlation; p = 0.58). G–I, There were no significant changes in the (G) mean-squared distance between odor centroids nor (H) the total variance across trials for each odor (Pearson correlation; mean-squared distance, p = 0.68; total variance, p = 0.73). I, There was also no change in the variance along the axis of discrimination (the axis containing the line connecting Odor 1 and Odor 2 centroids) for the decoder (Pearson correlation; p = 0.50). Unless otherwise stated, mean ± SEM are shown in line plots with error bars.

