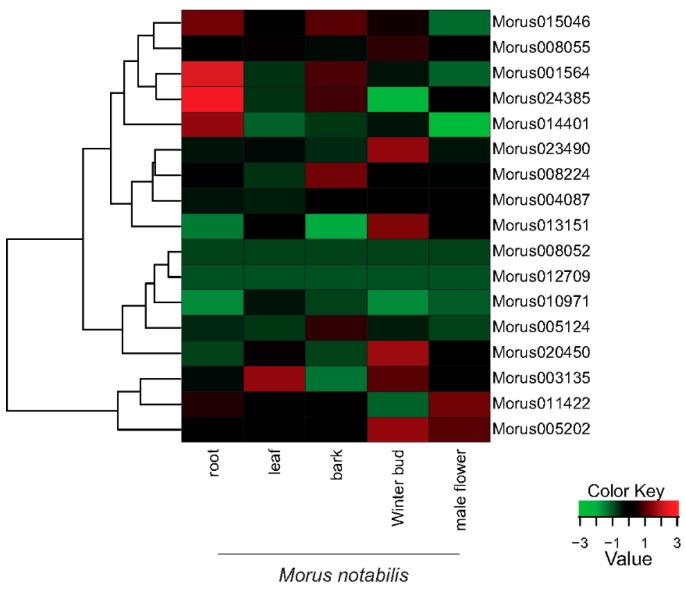
Figure 6.
A heat map showing the relative expression profiles of the identified 17 ARFs across the five developmental stages of Morus notabilis. FPKM values (median centre normalized) for all stages were used. Green represents down regulation while red represents up regulation (See legend for details).

