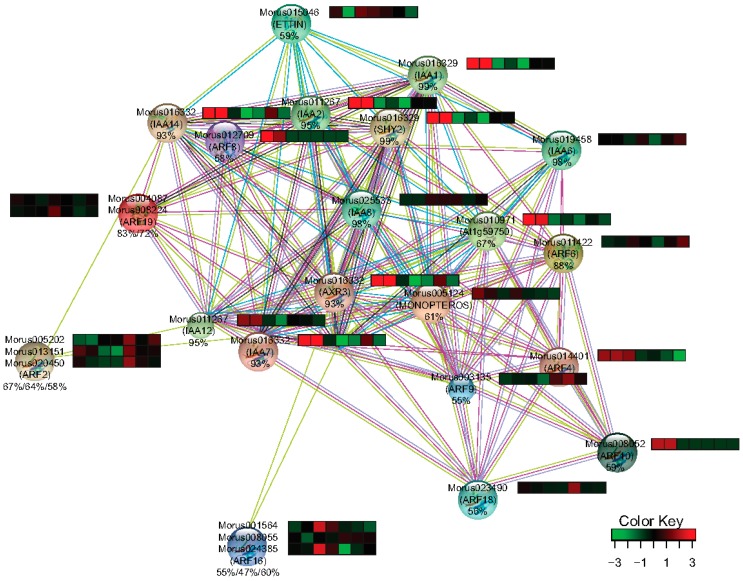
Figure 9.
The interaction network and expression profile of the identified interacting partners of ARFs in Morus. Heat maps show the expression level (FPKM values) across the seven stages used in this study. The percentage identities of the Morus genes with Arabidopsis genes are shown below the IDs. From left to right the stages are Morus laevigata leaf, Morus serrata leaf, Morus notabilis root, bark, winter bud, leaf and male flower.

