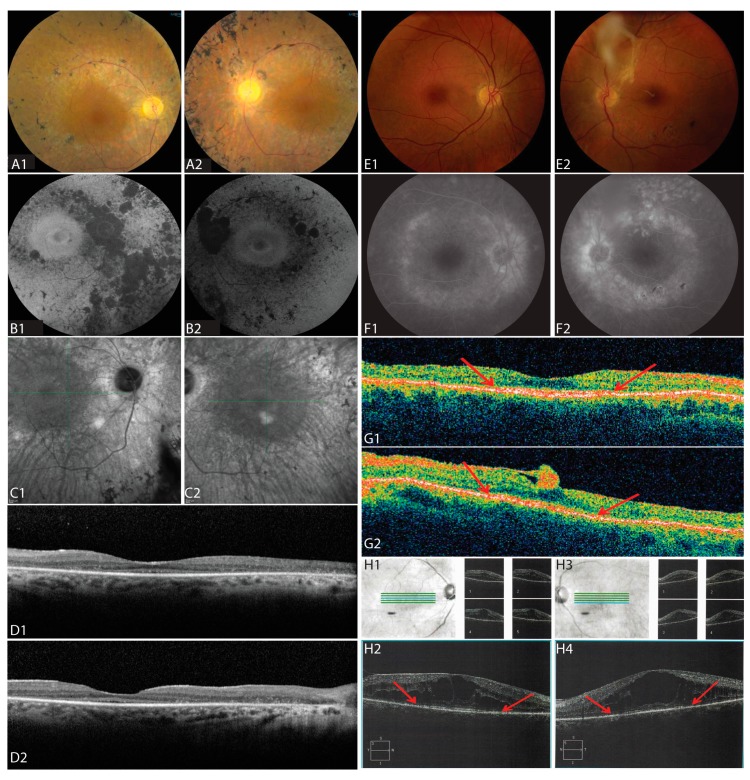
Figure 3.
Retinal Imaging. (A–D) Fundus imaging of the right (A1–D1) and left (A2–D2) eye of II:2 at age 60. (A1,A2) Color fundus photos show disc pallor, retinal vascular attenuation and bone spicule pigmentary change along the arcades. (B1,B2) Fundus autofluorescence shows a ring of increased autofluorescence in the macula and nummular loss of autofluorescence along the arcades in both eyes. (C1,C2) Infrared fundus images show retinal pigment epithelium (RPE) loss along the arcades, vascular attenuation, and bone spicules in both eyes. (D1,D2) Macular horizontal spectral domain optical coherence tomography (SD-OCT) scans show loss of outer retinal layers throughout the macula with preserved outer nuclear layer (ONL), external limiting membrane (ELM), and inner segments (IS) at the fovea in both eyes. (E–G) Fundus imaging of the right (E1–G1) and left (E2–G2) eye of II:4 at age 47. (E1,E2) Color fundus photos of the right eye show pigment mottling along the arcades (E1), and photos of the left eye shows a dense epiretinal membrane with overlying vitreous opacity and pigmentary changes along the inferotemporal arcade (E2). (F1,F2) Fluorescein angiography shows staining of the optic nerve and areas of RPE atrophy in late frames. (G1,G2) SD-OCT scans show a preserved ONL, ELM, and inner segment/outer segment (IS/OS) junction band at the fovea in both eyes; the edges of the IS/OS junction band are demarcated by red arrows. (H1–H4) Infrared fundus images and SD-OCT B-scans of the right (H1,H2) and left (H3,H4) of patient II:6 at age 58. Blue lines indicate location of SD-OCT B-scans (bottom) and green lines show locations of smaller scans showing cystoid macular edema with large foveal cysts and IS/OS junction band loss; red arrows indicate the edges of the IS/OS junction band.

