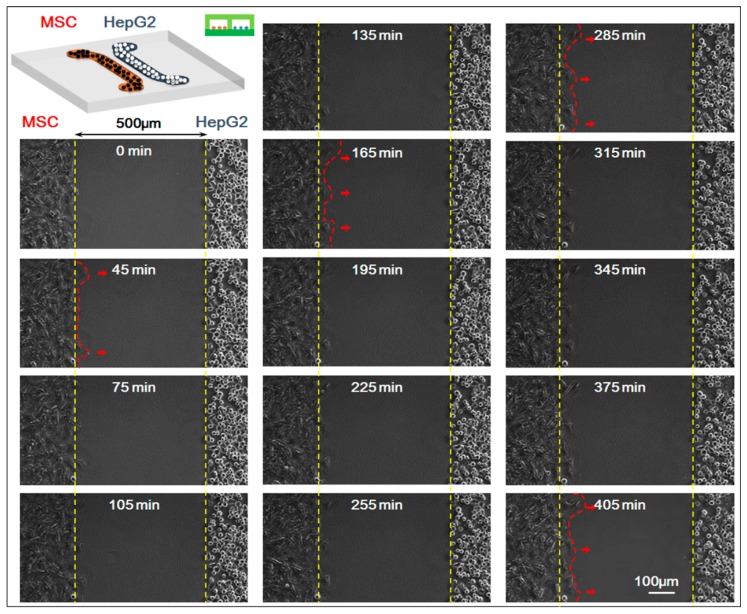
Figure 3.
Time-lapse images of interactions between mesenchymal stem cells (MSCs) and HepG-2 cells. The starting time (0 min) indicated the first 5 min after the upper chip was removed and after that, a picture was taken every 15 min; a total of 28 pictures (405 min) were taken. Fourteen pictures were shown. Bar is 100 µm.

